


Fall 2019
inclusive
interaction
sponsored studio
Kennedy Liggett
Joseph Rogers
Rachel Thomas
Partner with SAS, an analytics software company, to design an interactive web tool that teaches data concepts to middle schoolers. Each group will be assigned a data concept, as well as a device. (For my group in particular, we were assigned teaching distribution through the use of a laptop.)
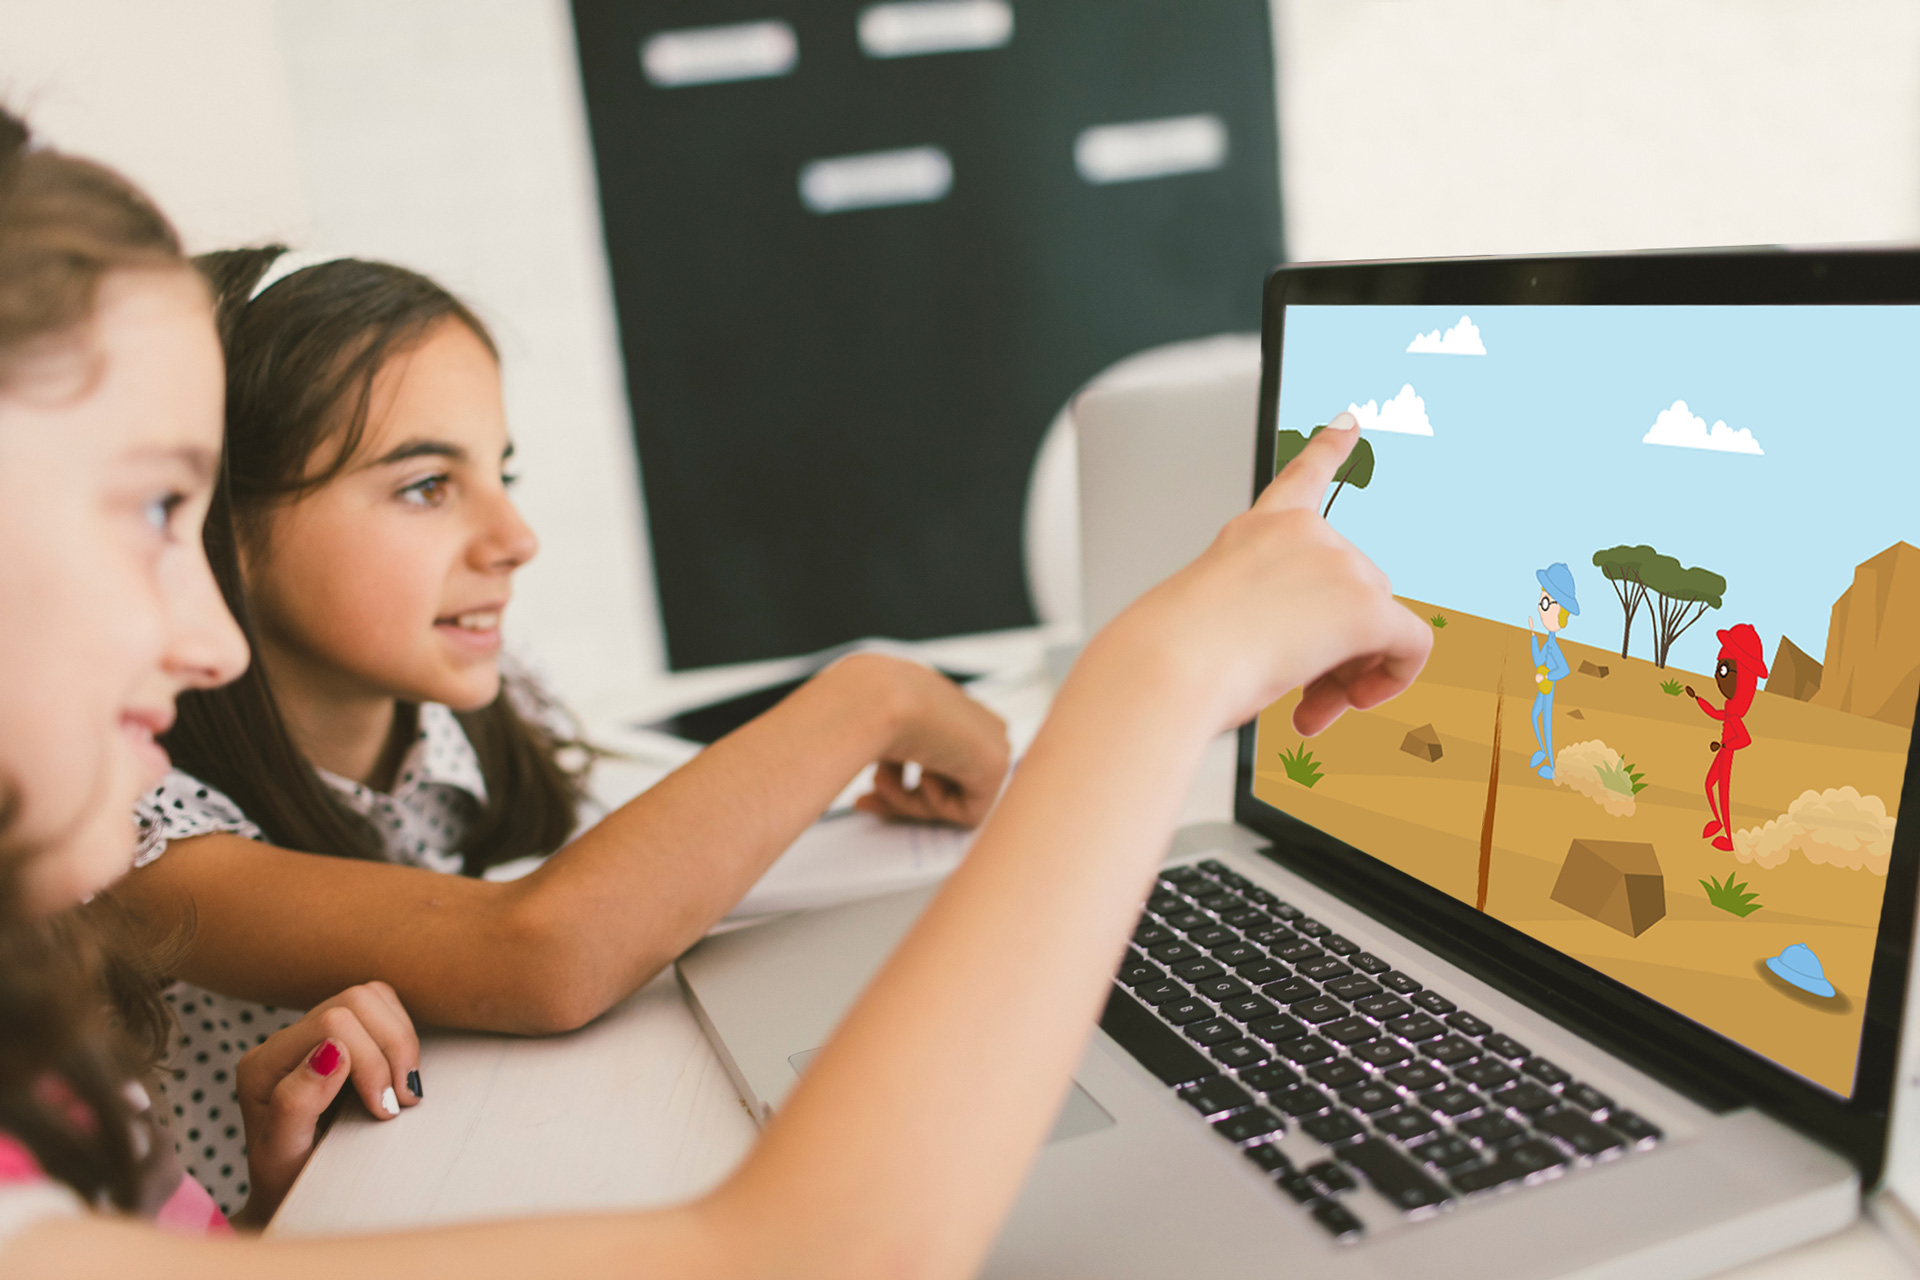
The Blobinsons is a conversational interface that teaches middle schoolers about distribution by personifying data sets through different blob characters. Each character represents a unique data set, allowing for a wide range of topics, guaranteeing a student finds a data set they’re interested in.

We began by attending the project launch at SAS headquarters. While there, we learned what SAS wanted to accomplish with this project and how we could begin thinking about our individual data concepts.
To get a better understanding of middle schoolers, we visited Centennial Campus Middle School and conducted a discussion with a few of their teachers. From that discussion, we learned what currently motivates and deters middle schoolers and got a better insight into their minds.
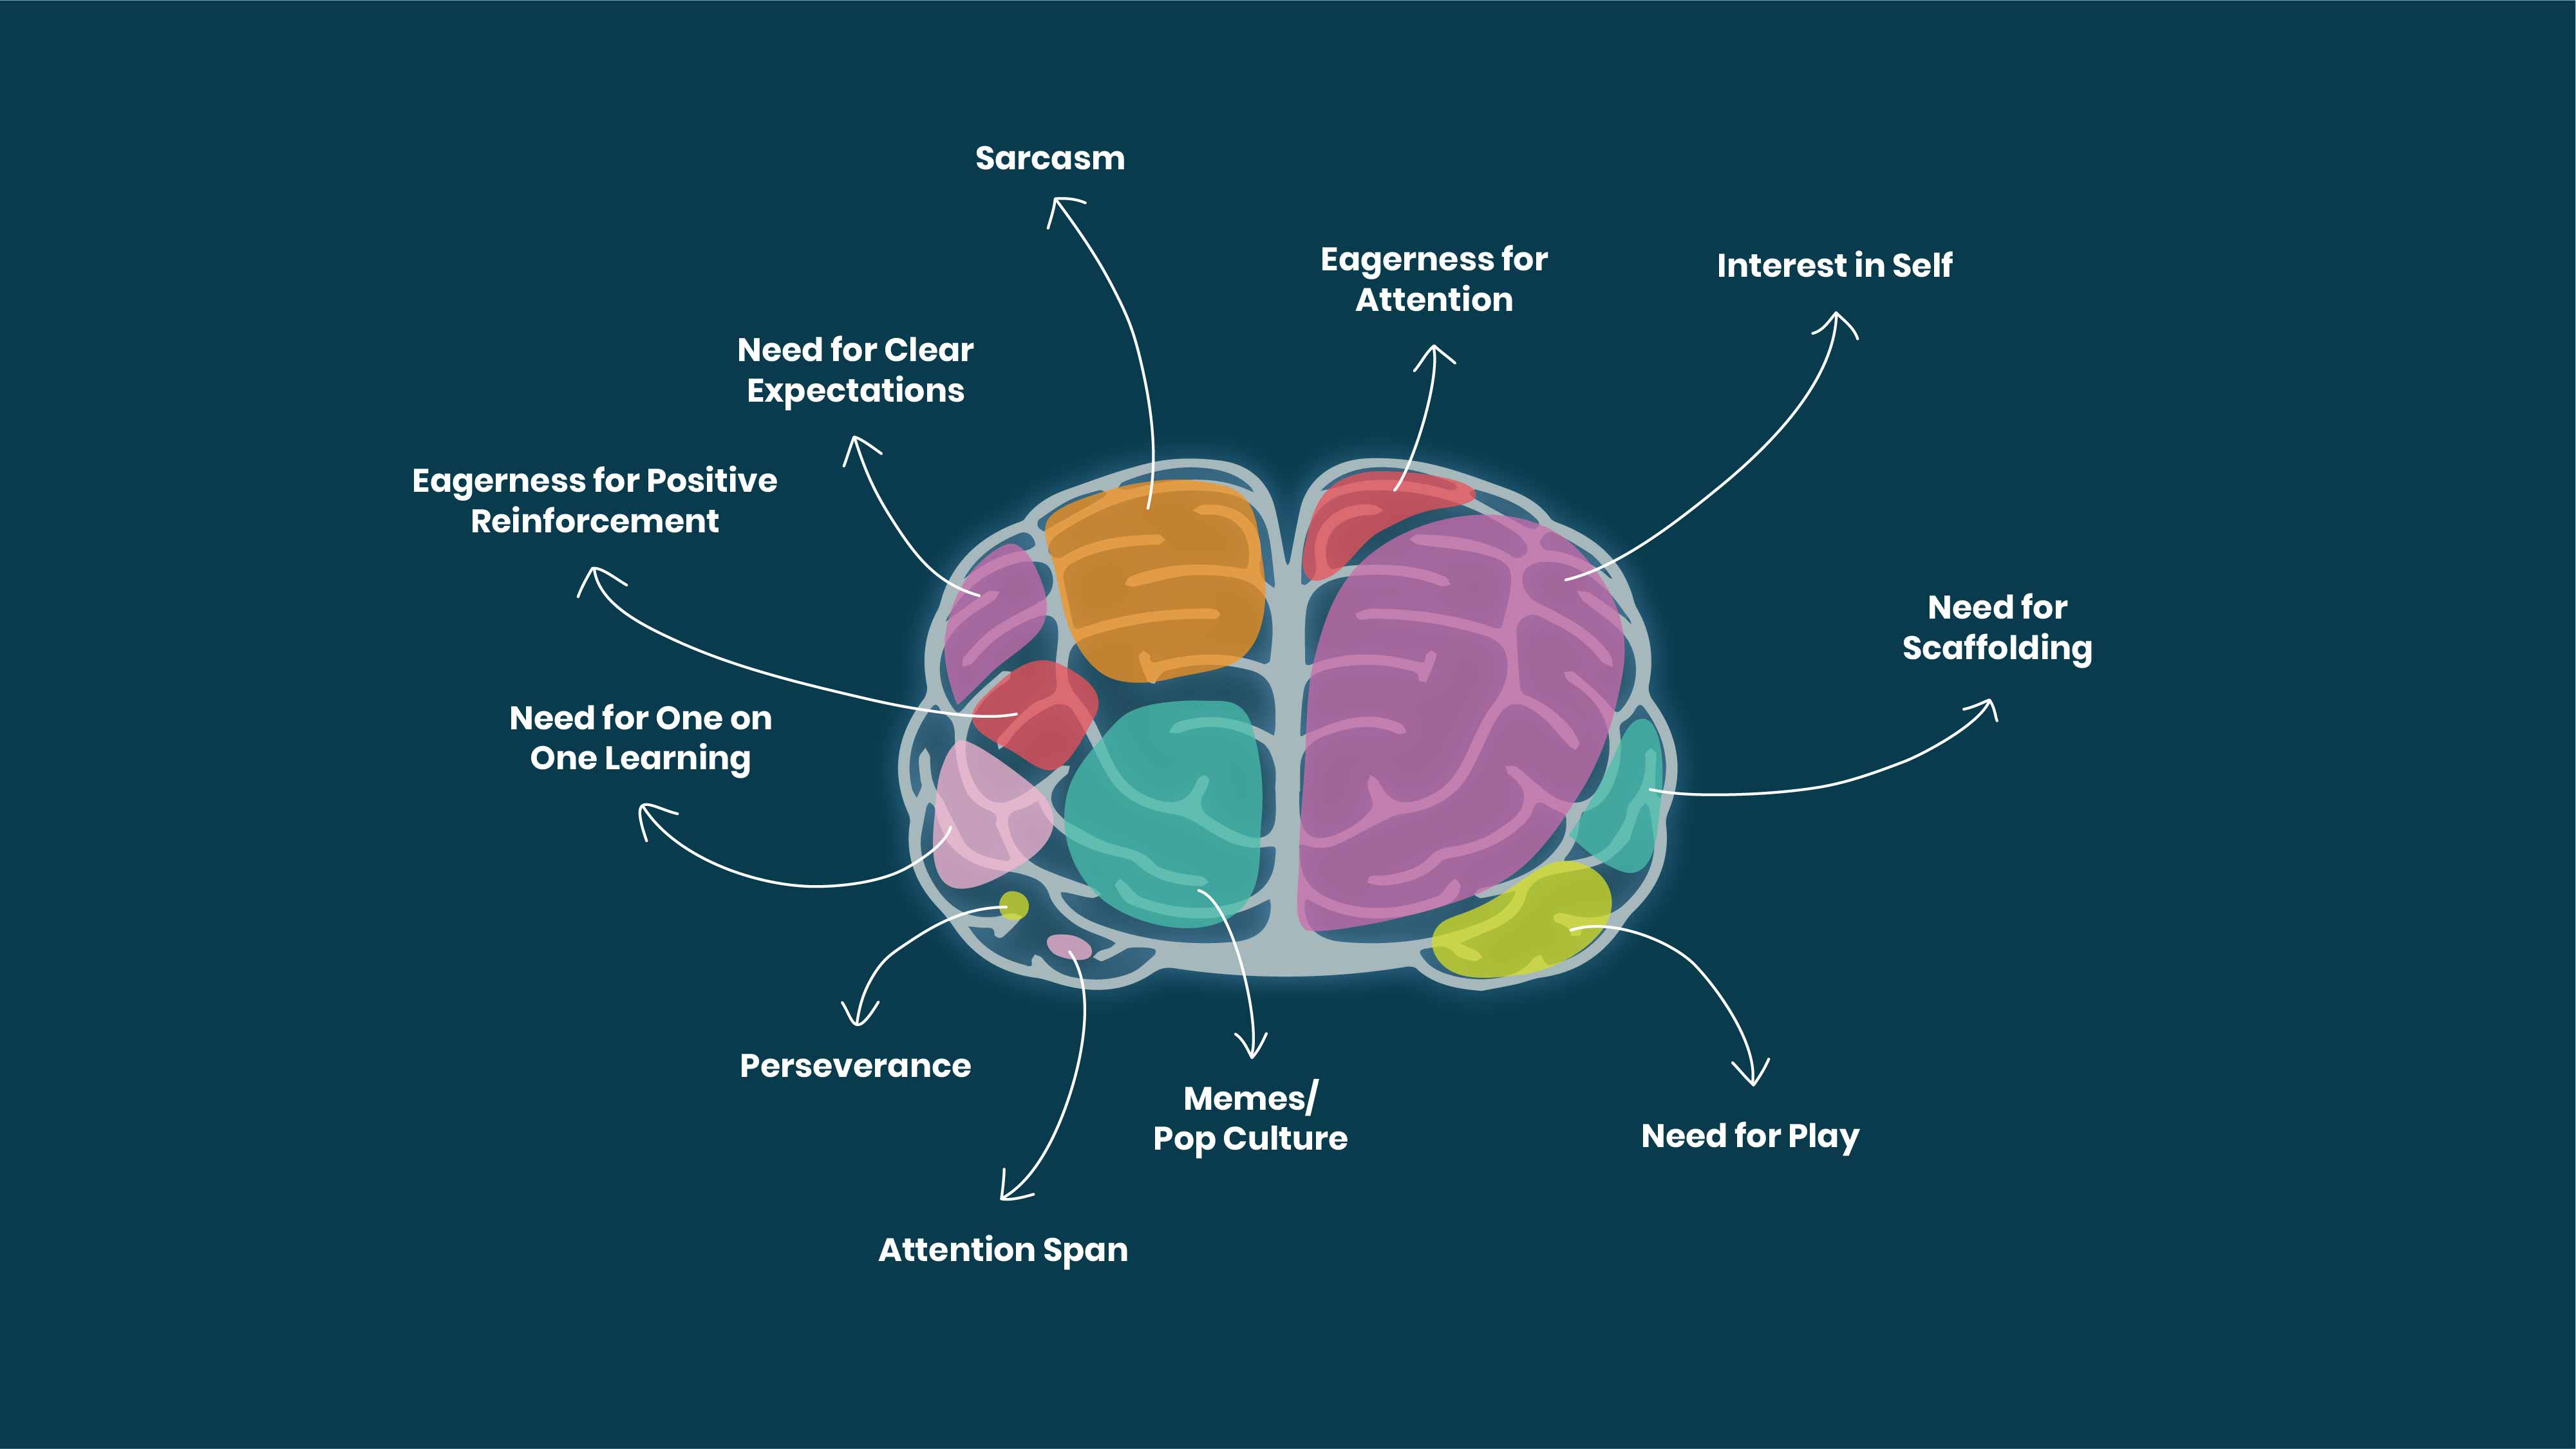
To gain an even better understanding, we each interviewed two middle schoolers and collated our findings. These interviews, along with our teacher discussion, helped us build our personas.


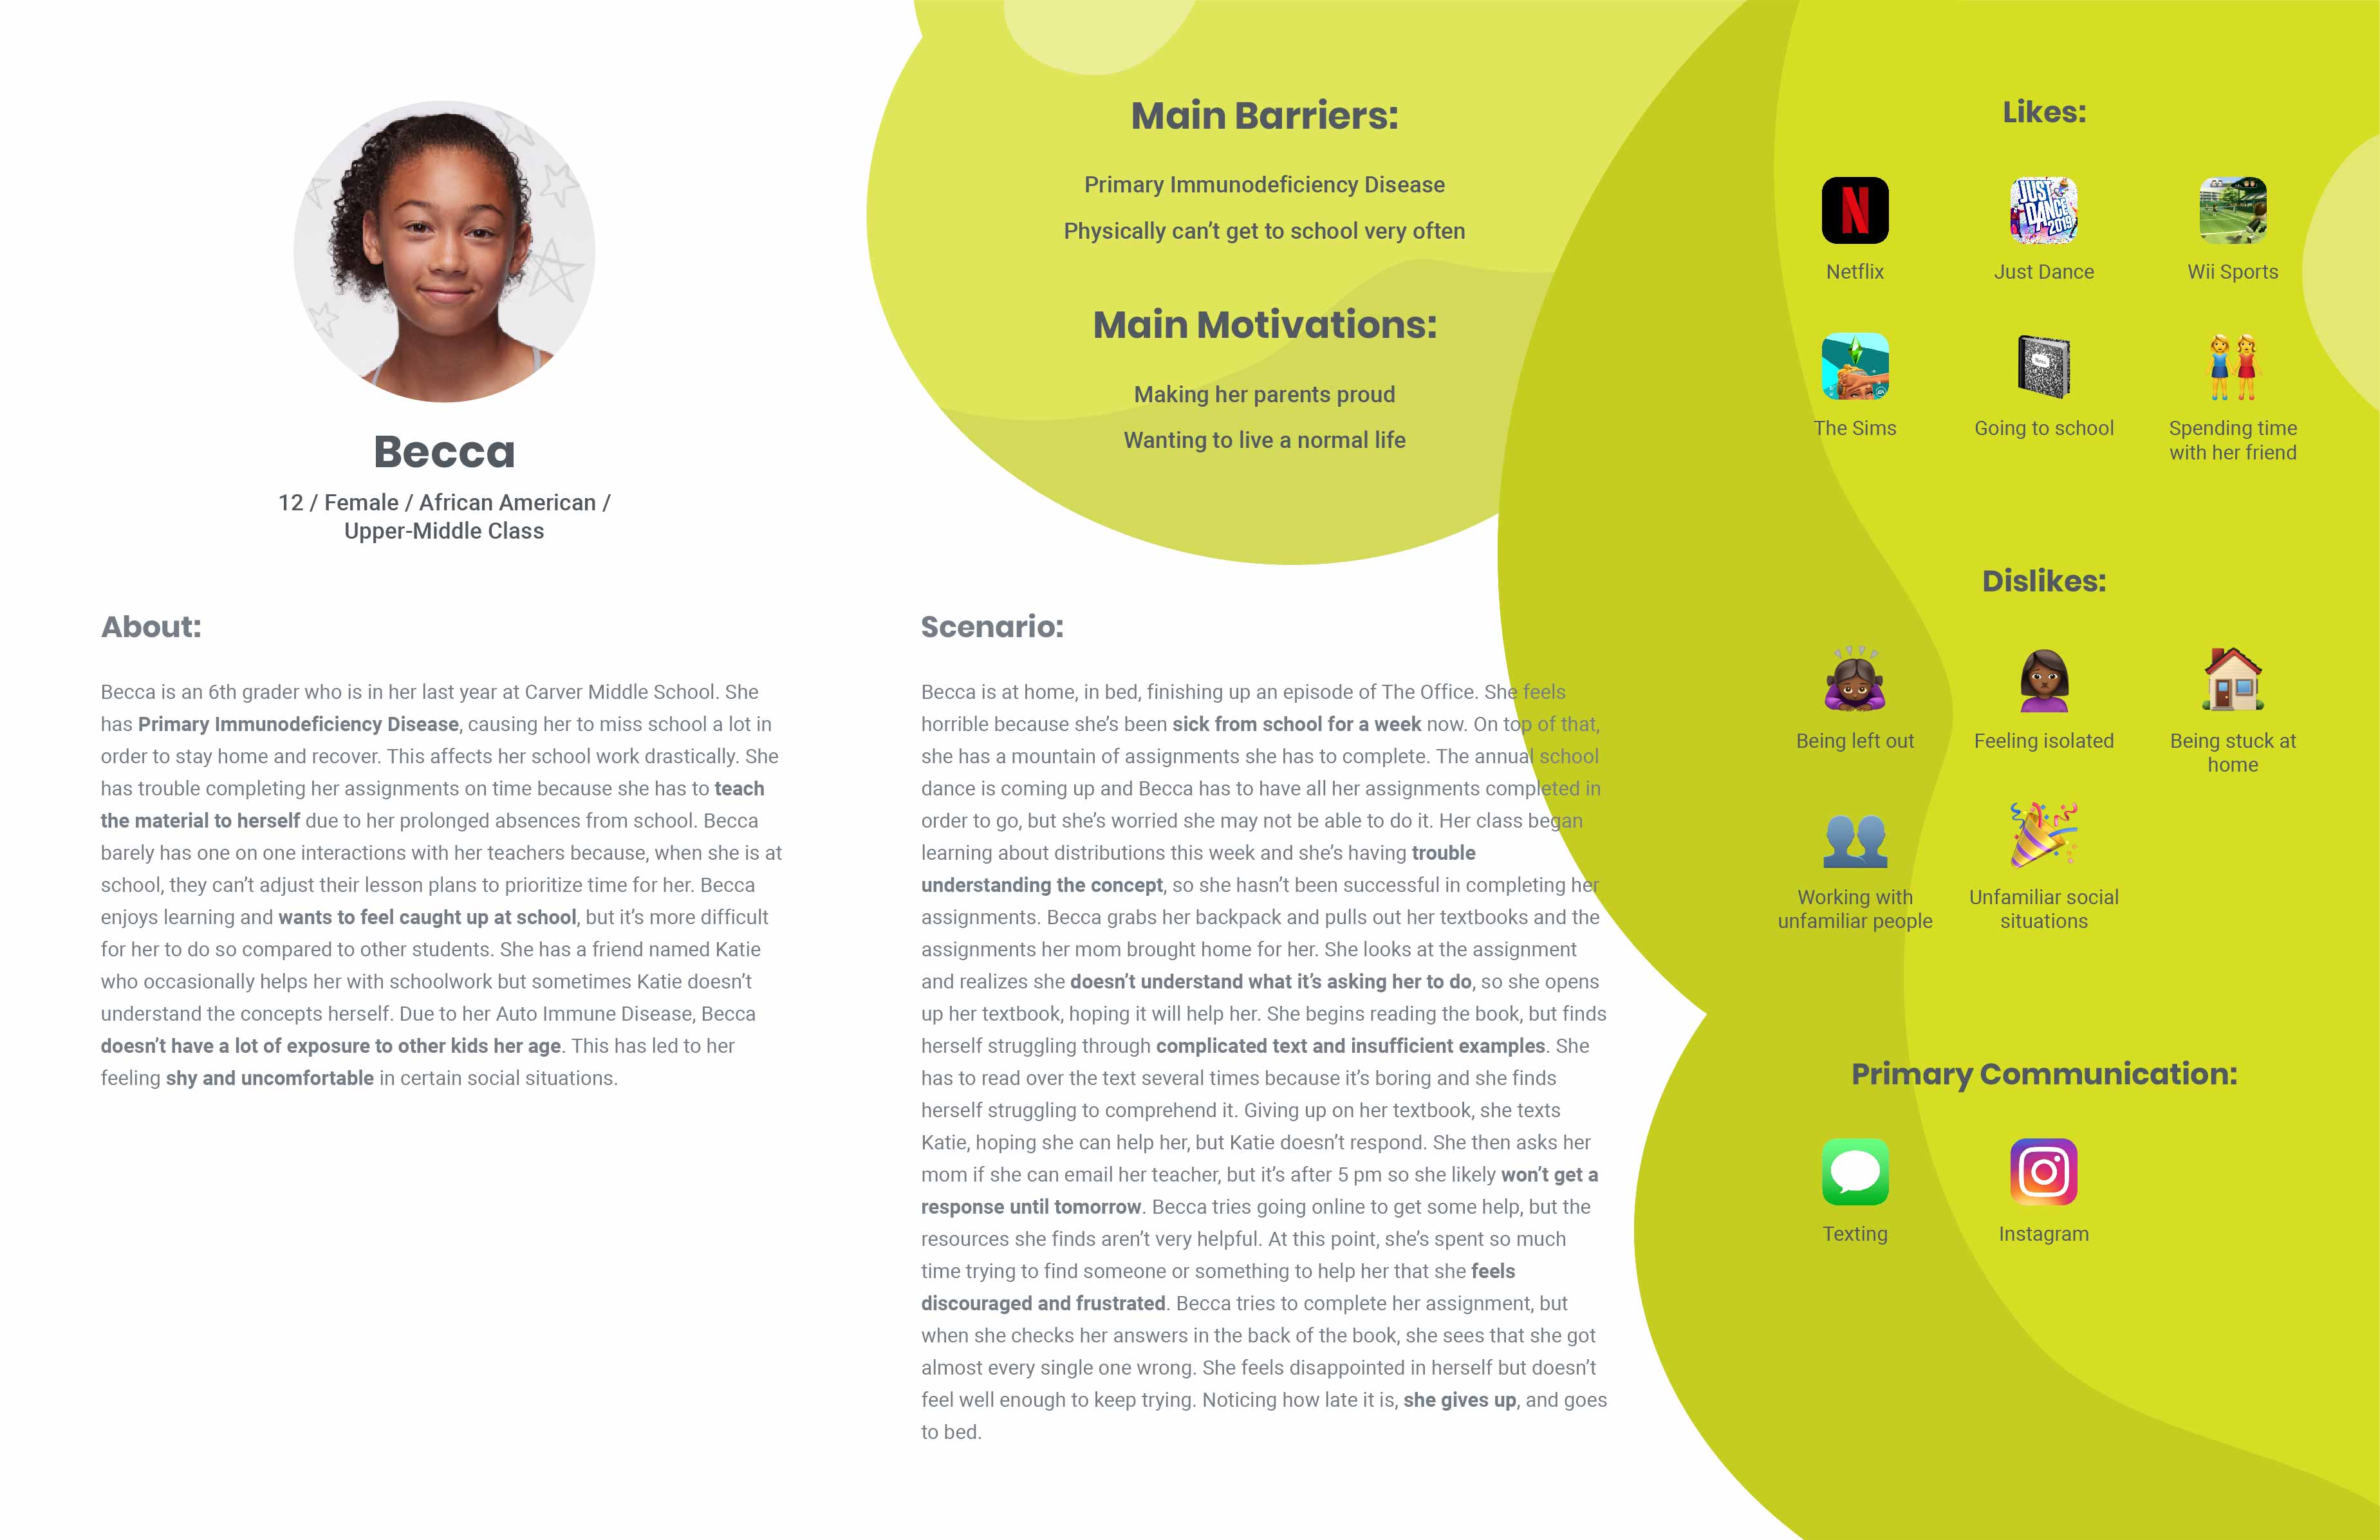
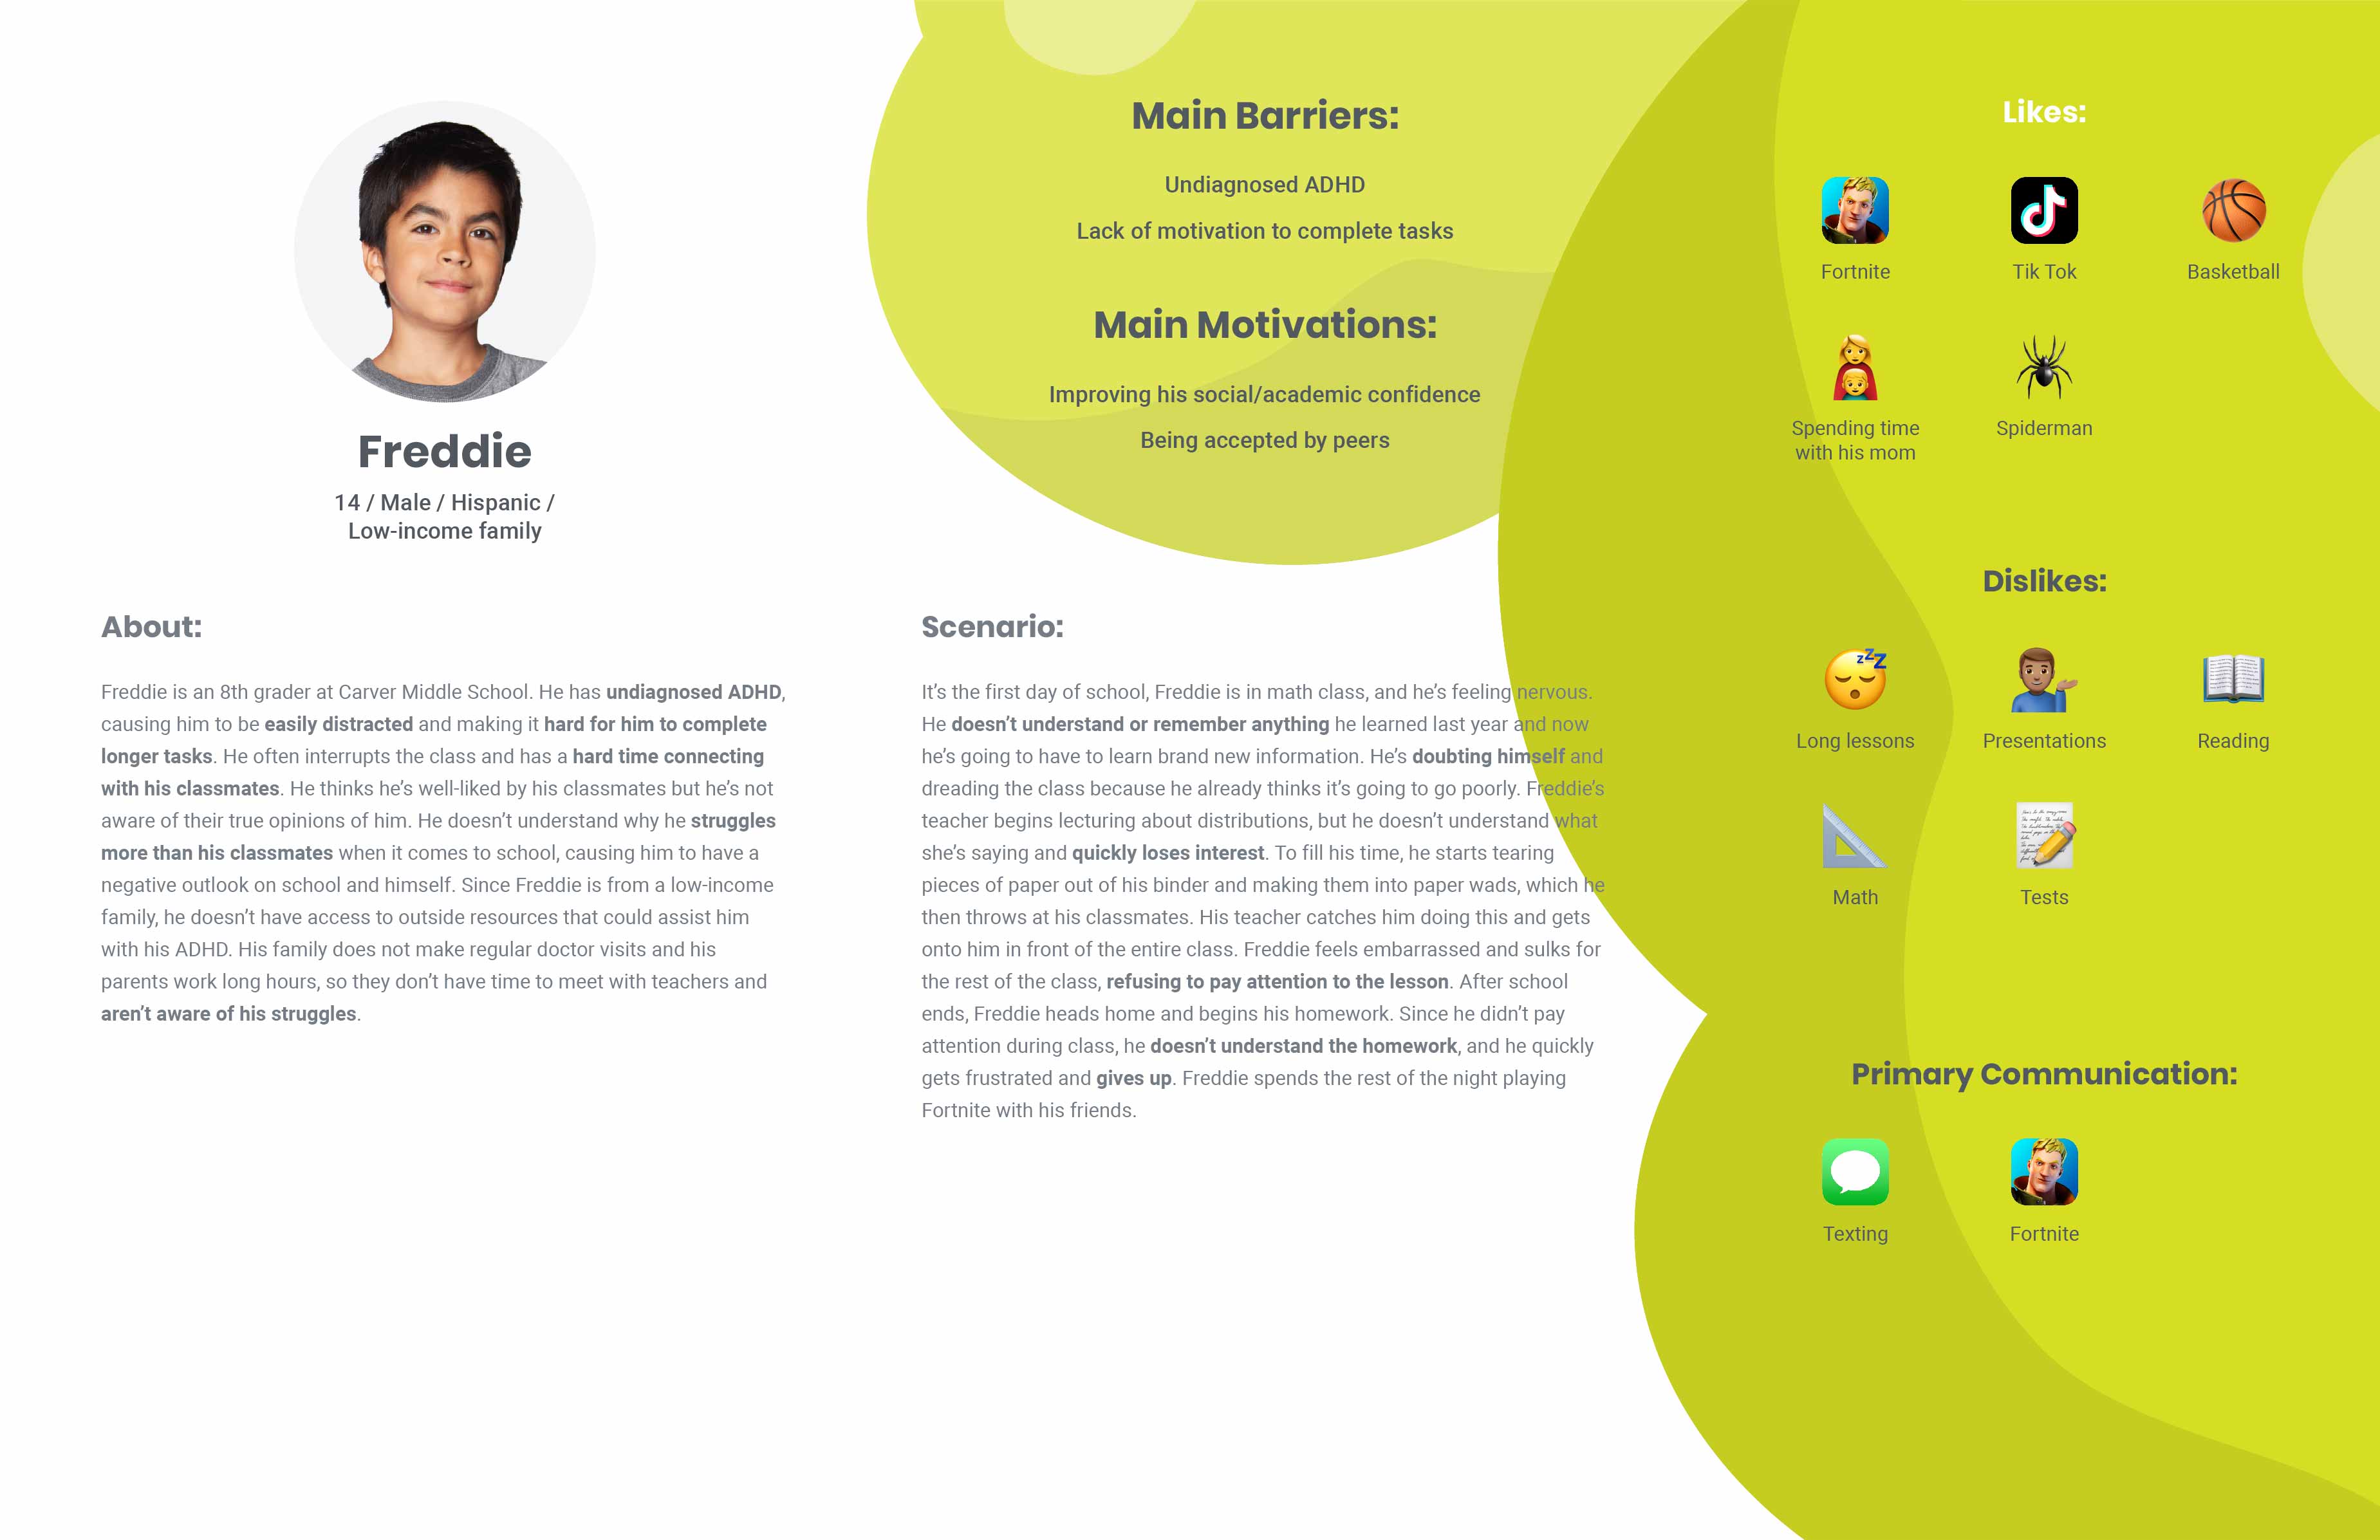
We then created our personas, thinking about their main barriers and motivations. We were asked to create one persona, but decided to create two because we wanted to ensure our tool could be adapted for different students’ needs.
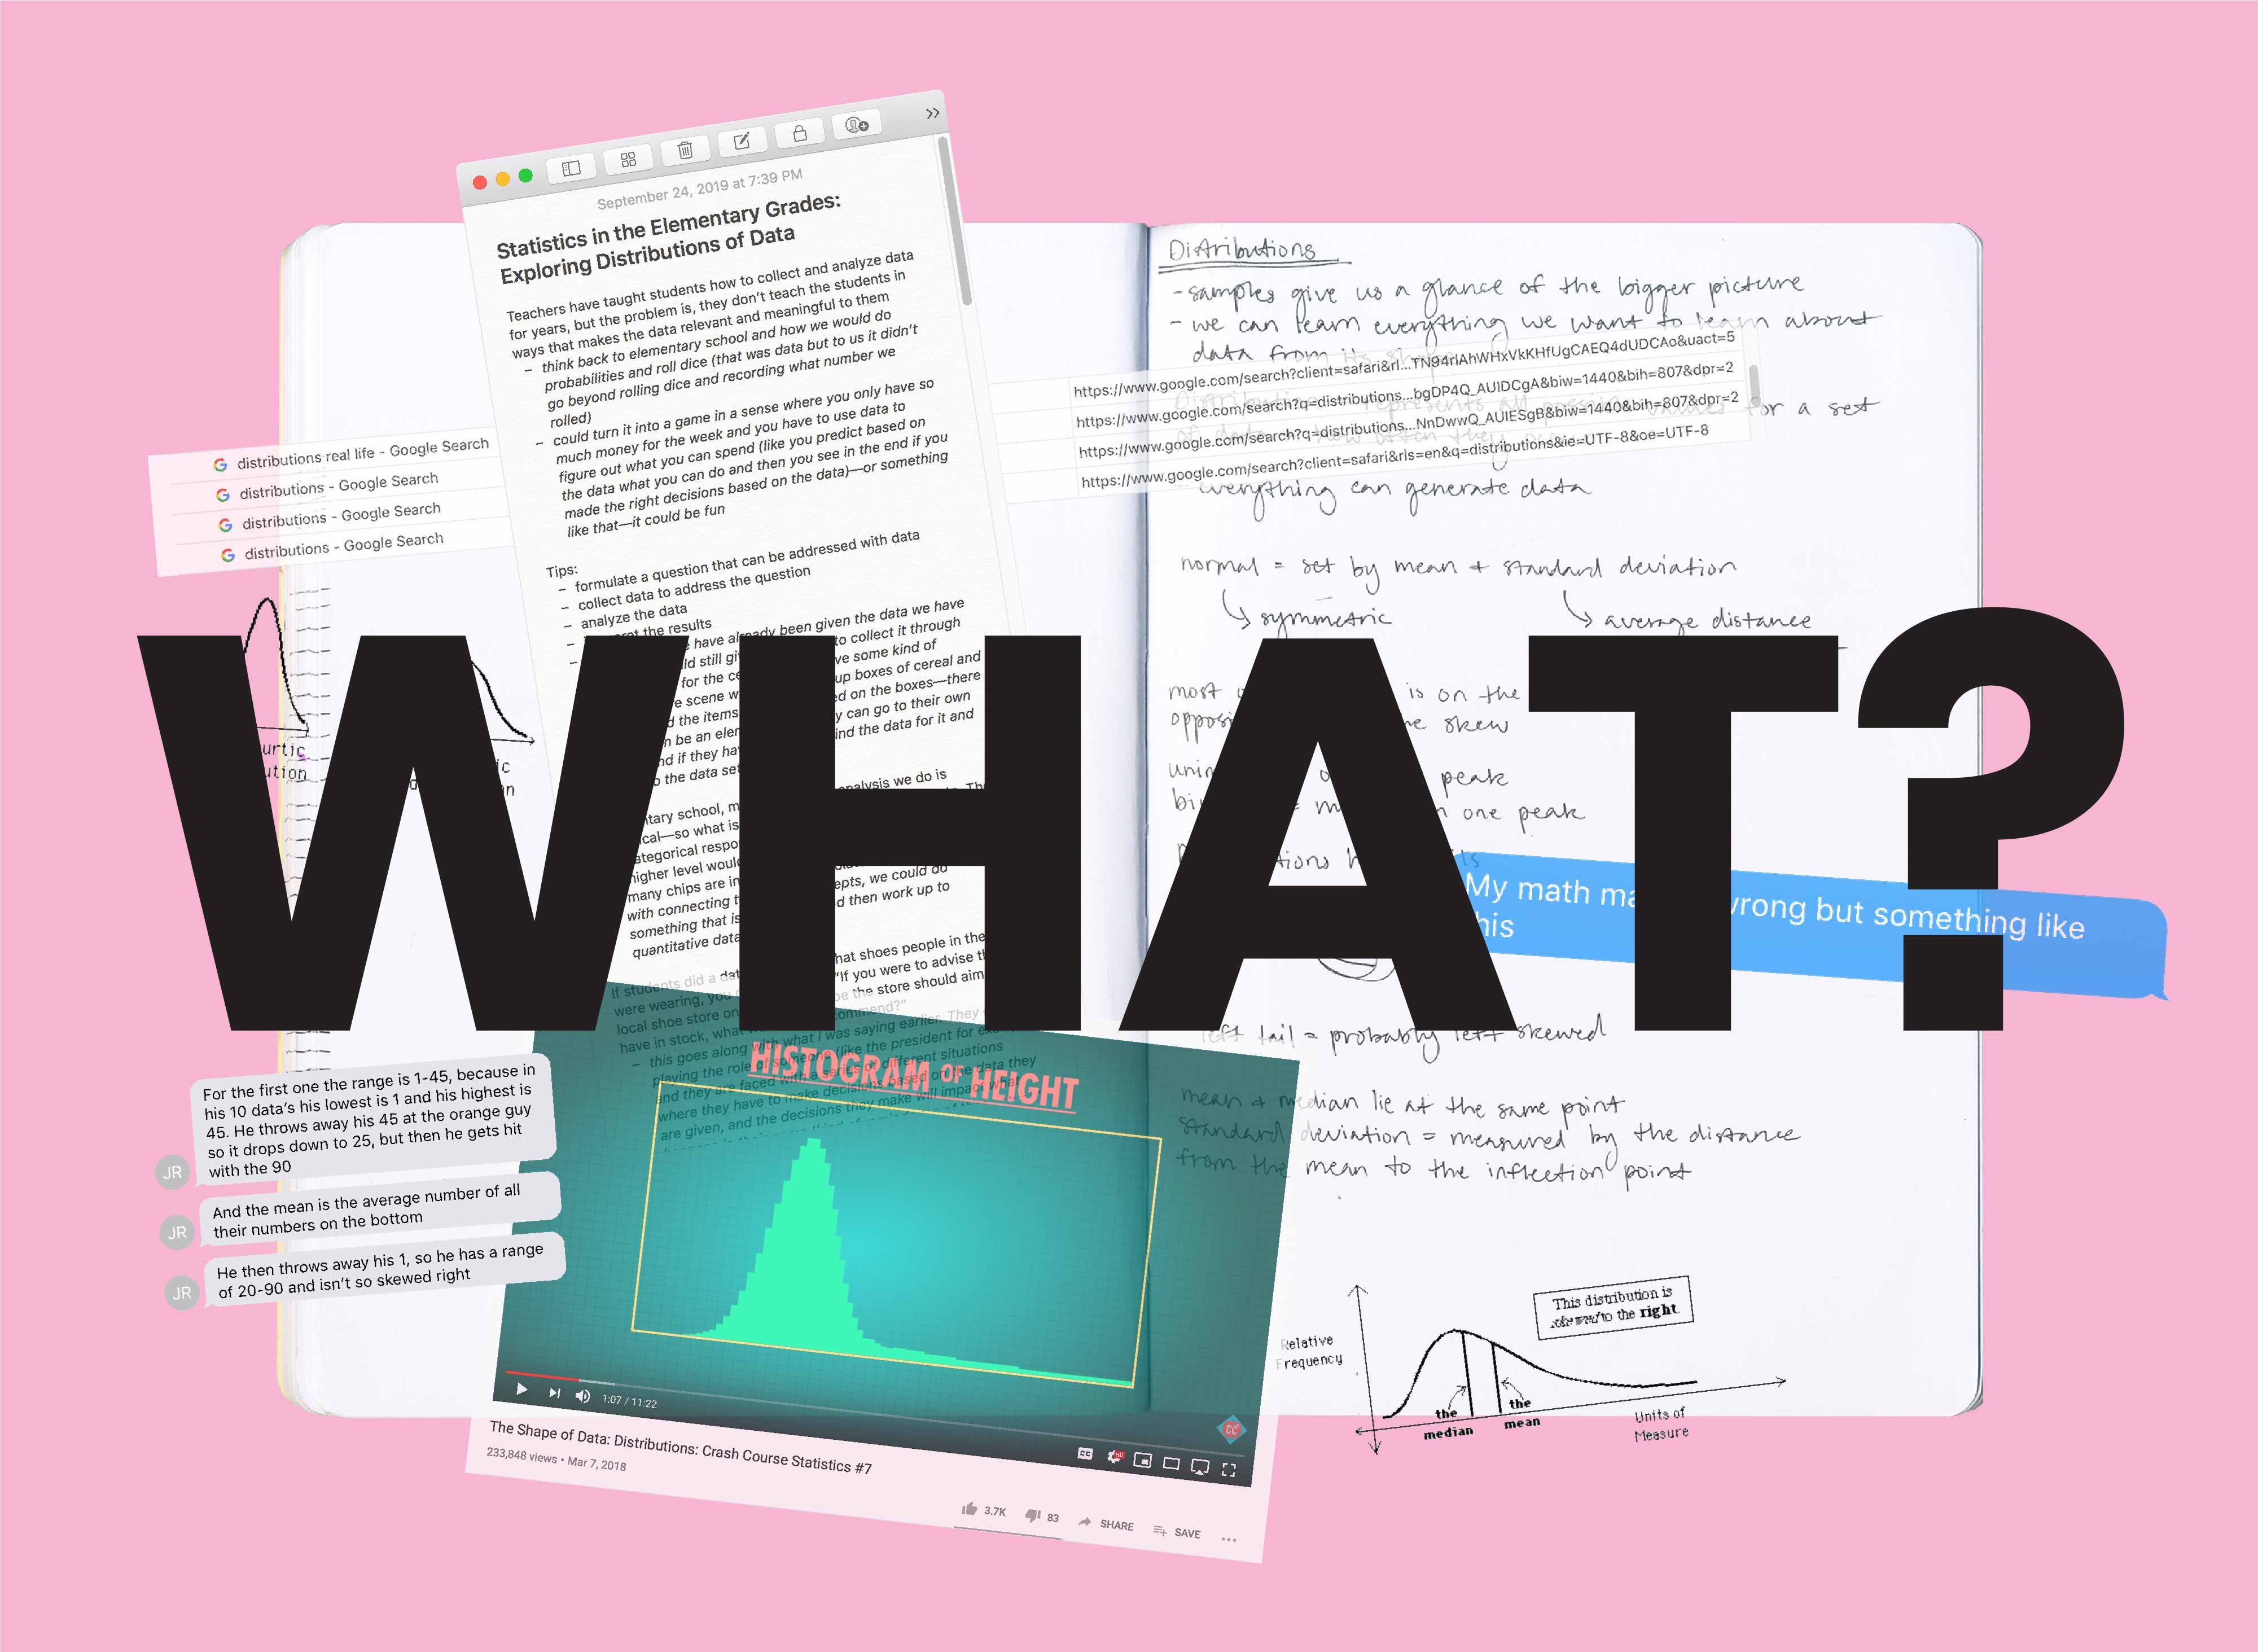
We then took on the hefty task of trying to understand distributions. We couldn’t begin to teach others about distribution if we didn’t understand it ourselves. Having never taken a statistics course, this turned out to be quite a challenge.
To inform us with our own tools, we found and analyzed the user experience of existing digital tools that taught a concept. From our analyses, we developed a list of guidelines we felt were critical to the success of a tool.
We then developed two rough concepts for our tool and had our first critique with SAS. After receiving feedback, we refined our two concepts into one and continued iterating.
We then developed hi-fi wireframes of our tool and had our second critique with SAS. During that critique, they emphasized that our UI elements needed to match the playfulness of our blob characters, and that they wanted a feature that allowed students to input their own data into the tool.
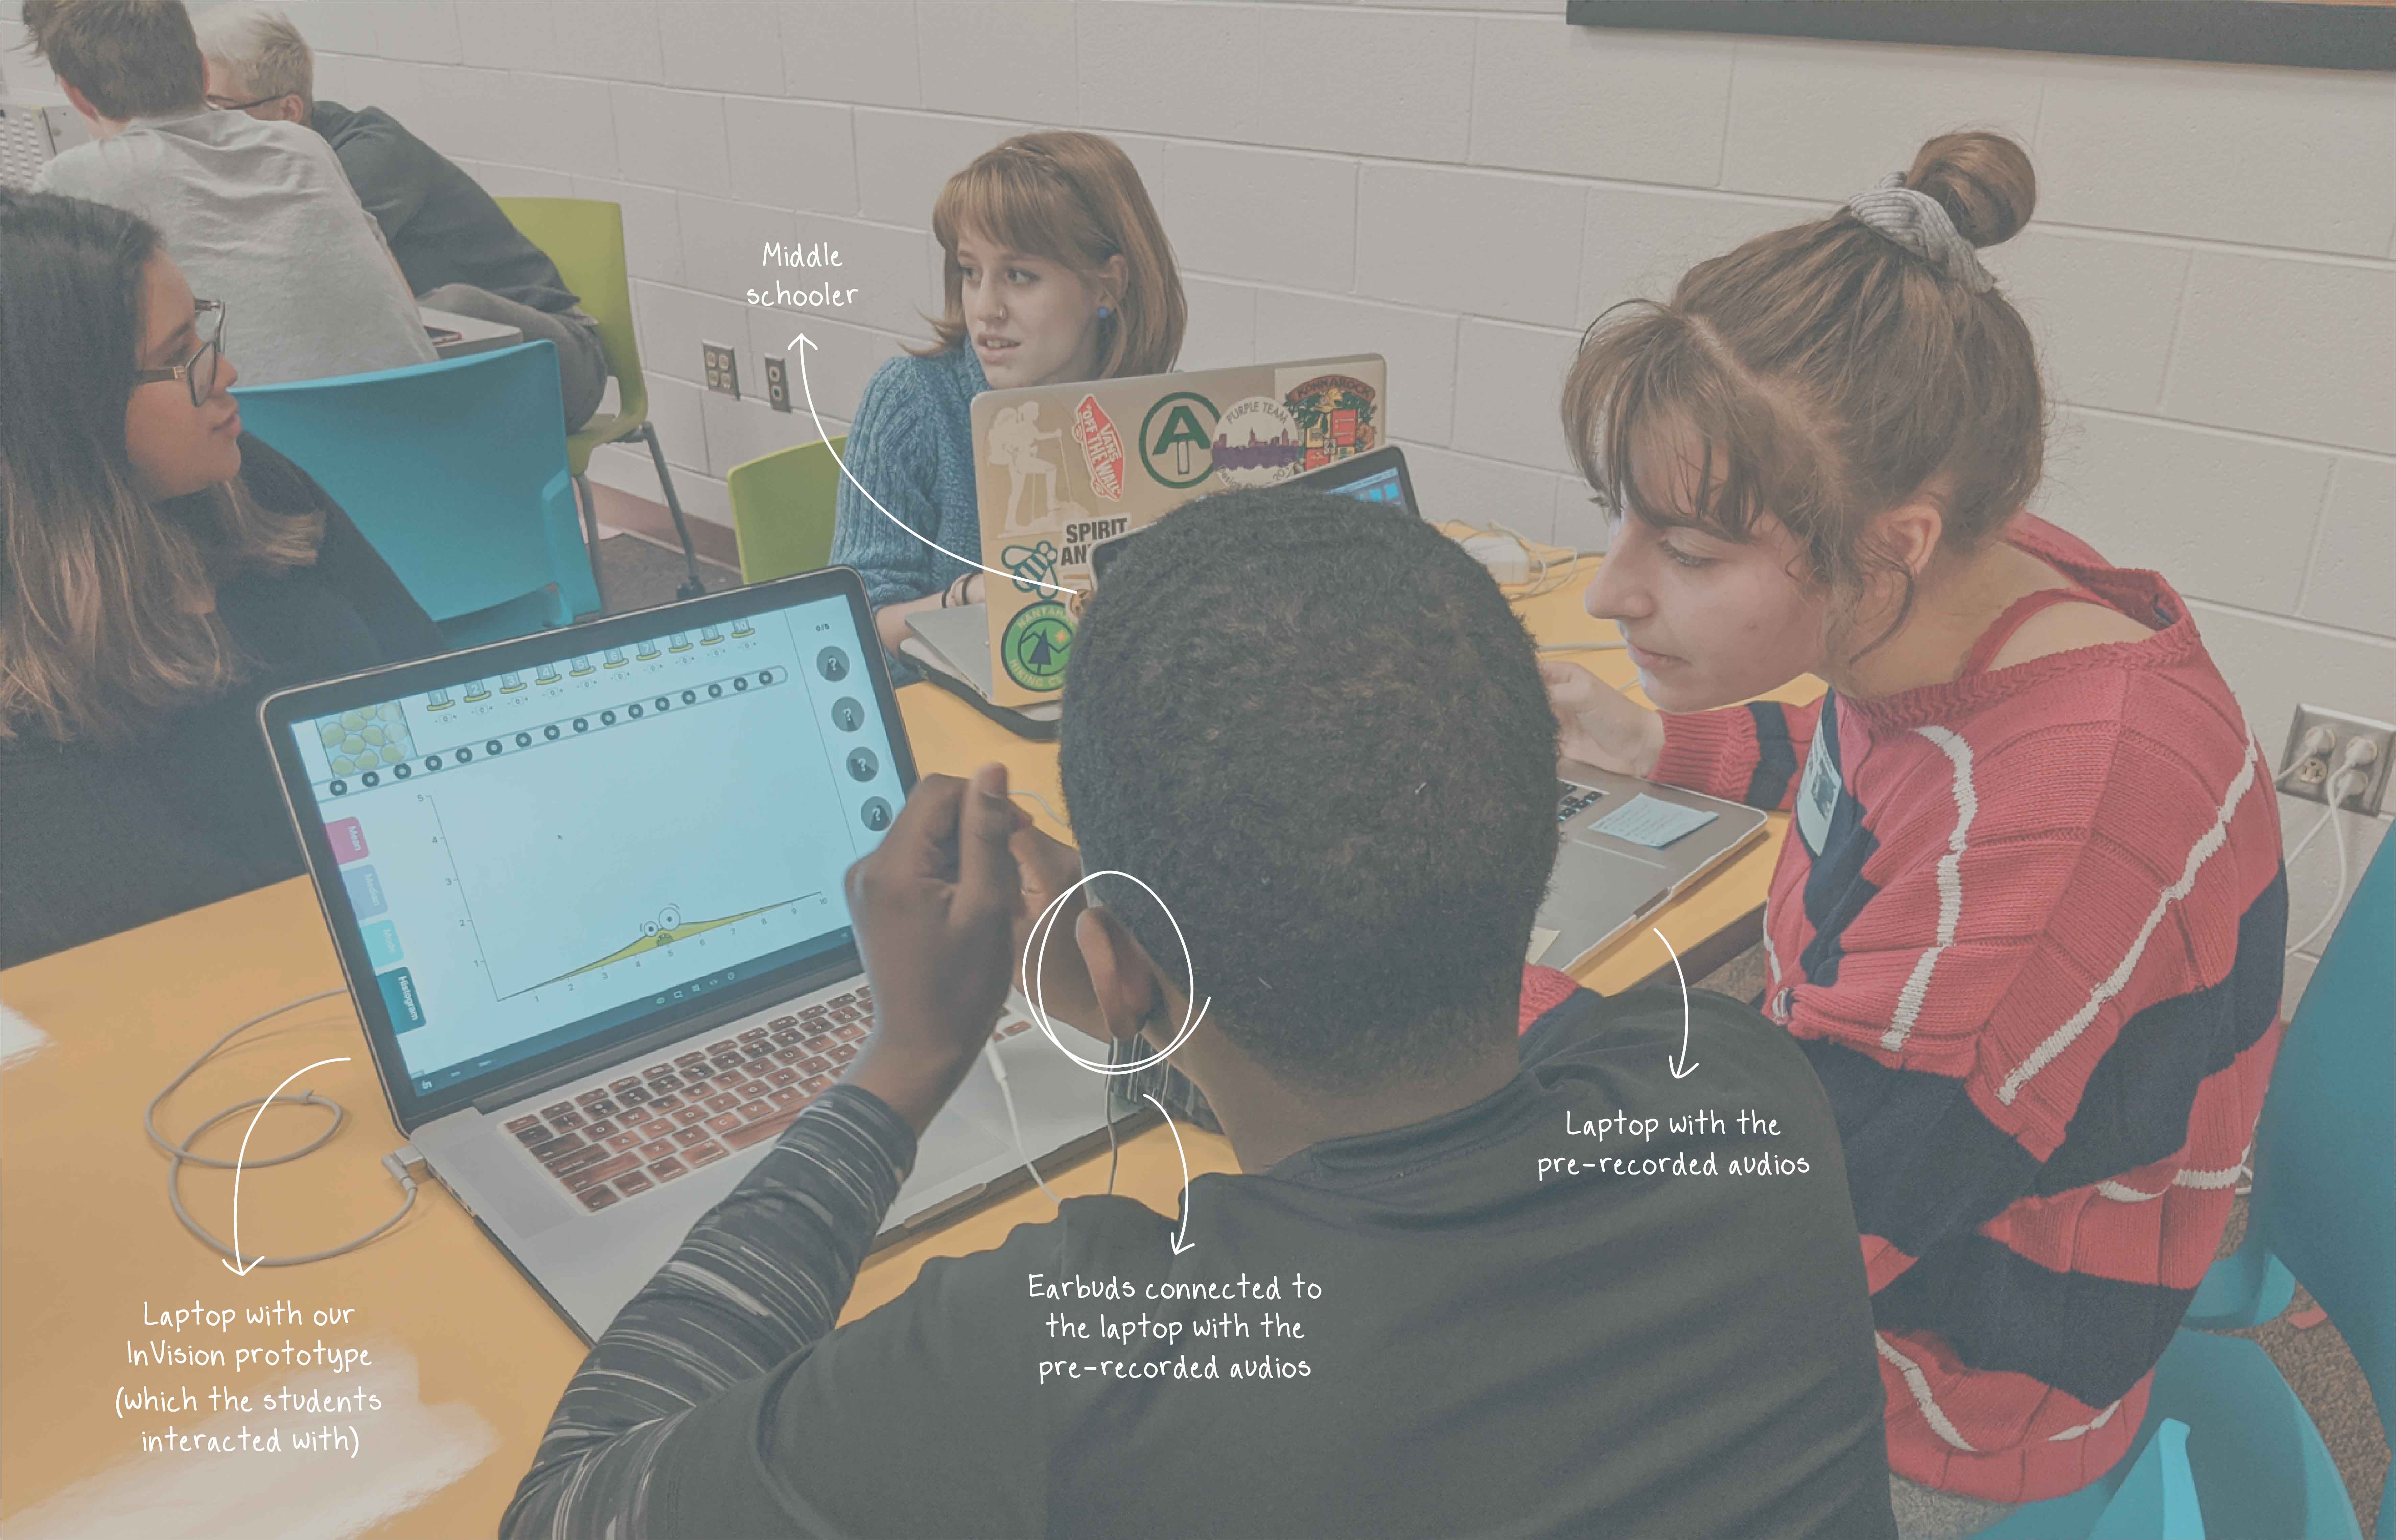
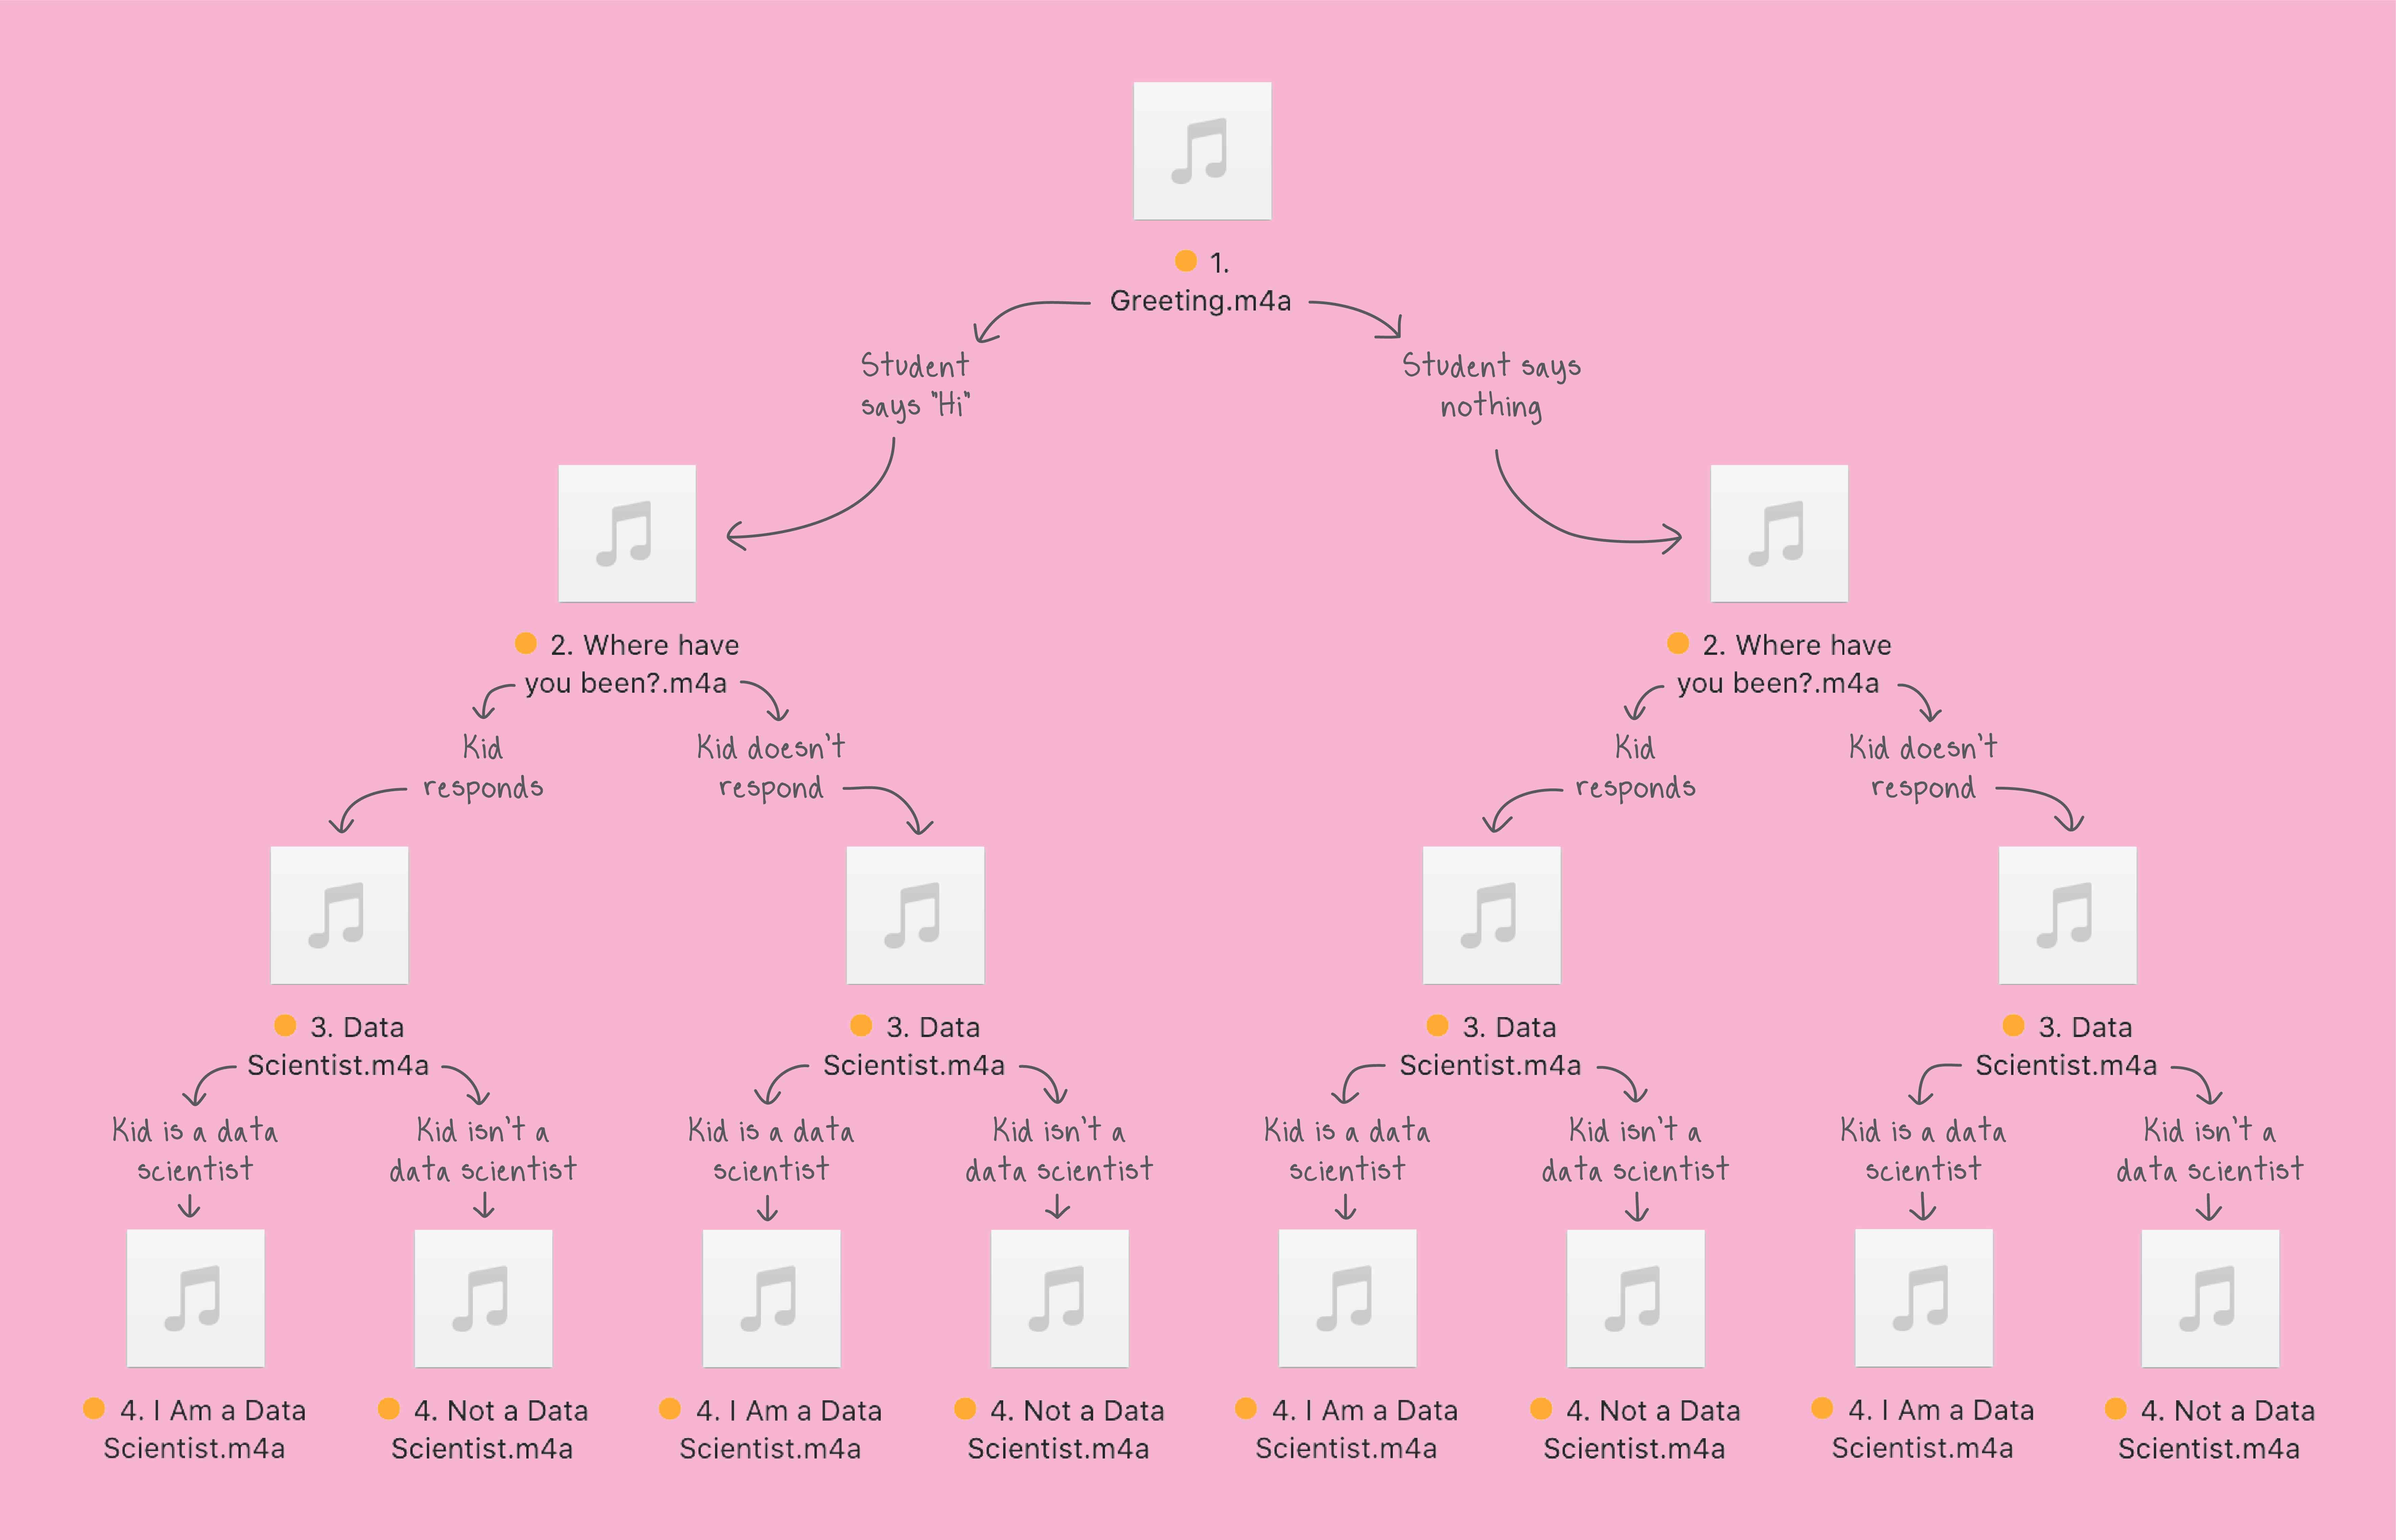
We then developed a rough draft of our tool in InVision and user tested it with middle schoolers. To simulate the conversational aspect of our tool, we recorded dialogue for the blobs, and then made a list of the different responses the students may have to those blobs. We then created audios of several blob responses that would be appropriate depending on what the students said. When doing our user testing, the students wore headphones that were connected to my laptop—which had all the prerecorded audios on it. As they progressed through the tool, I would play the pre-recorded audios that were appropriate for their reactions, so it felt like they were having a conversation, when in reality, they weren’t.

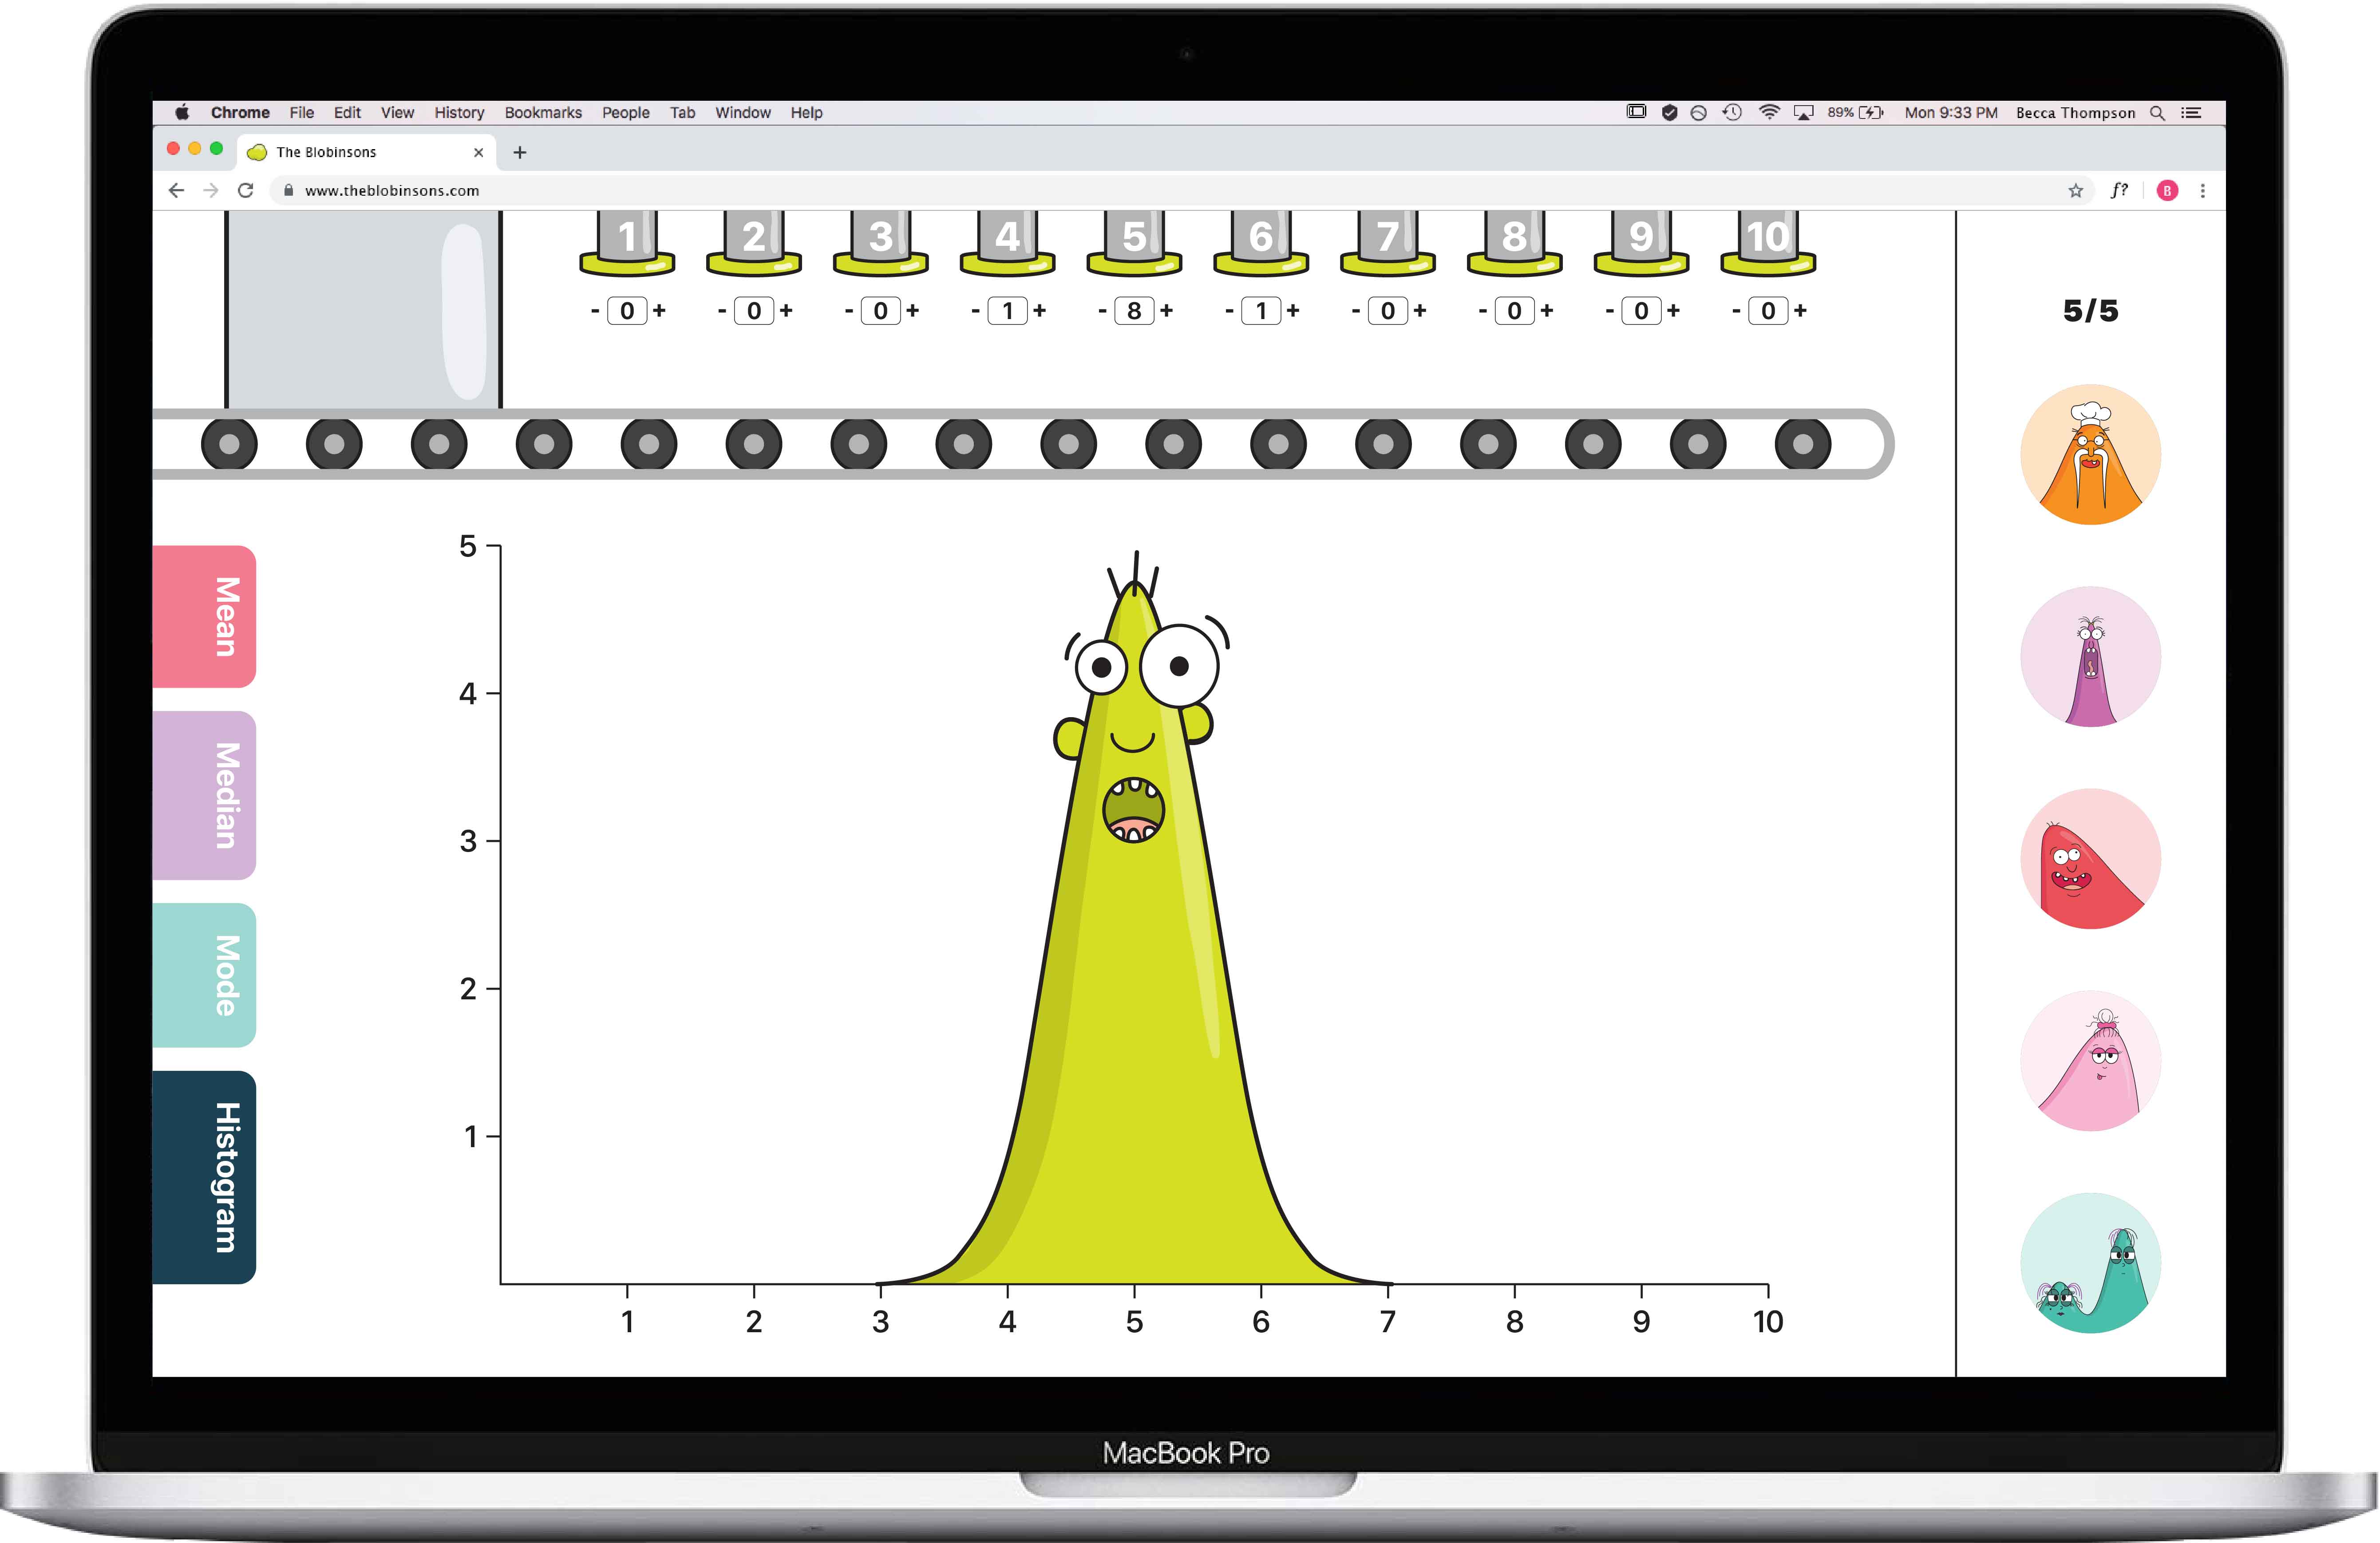
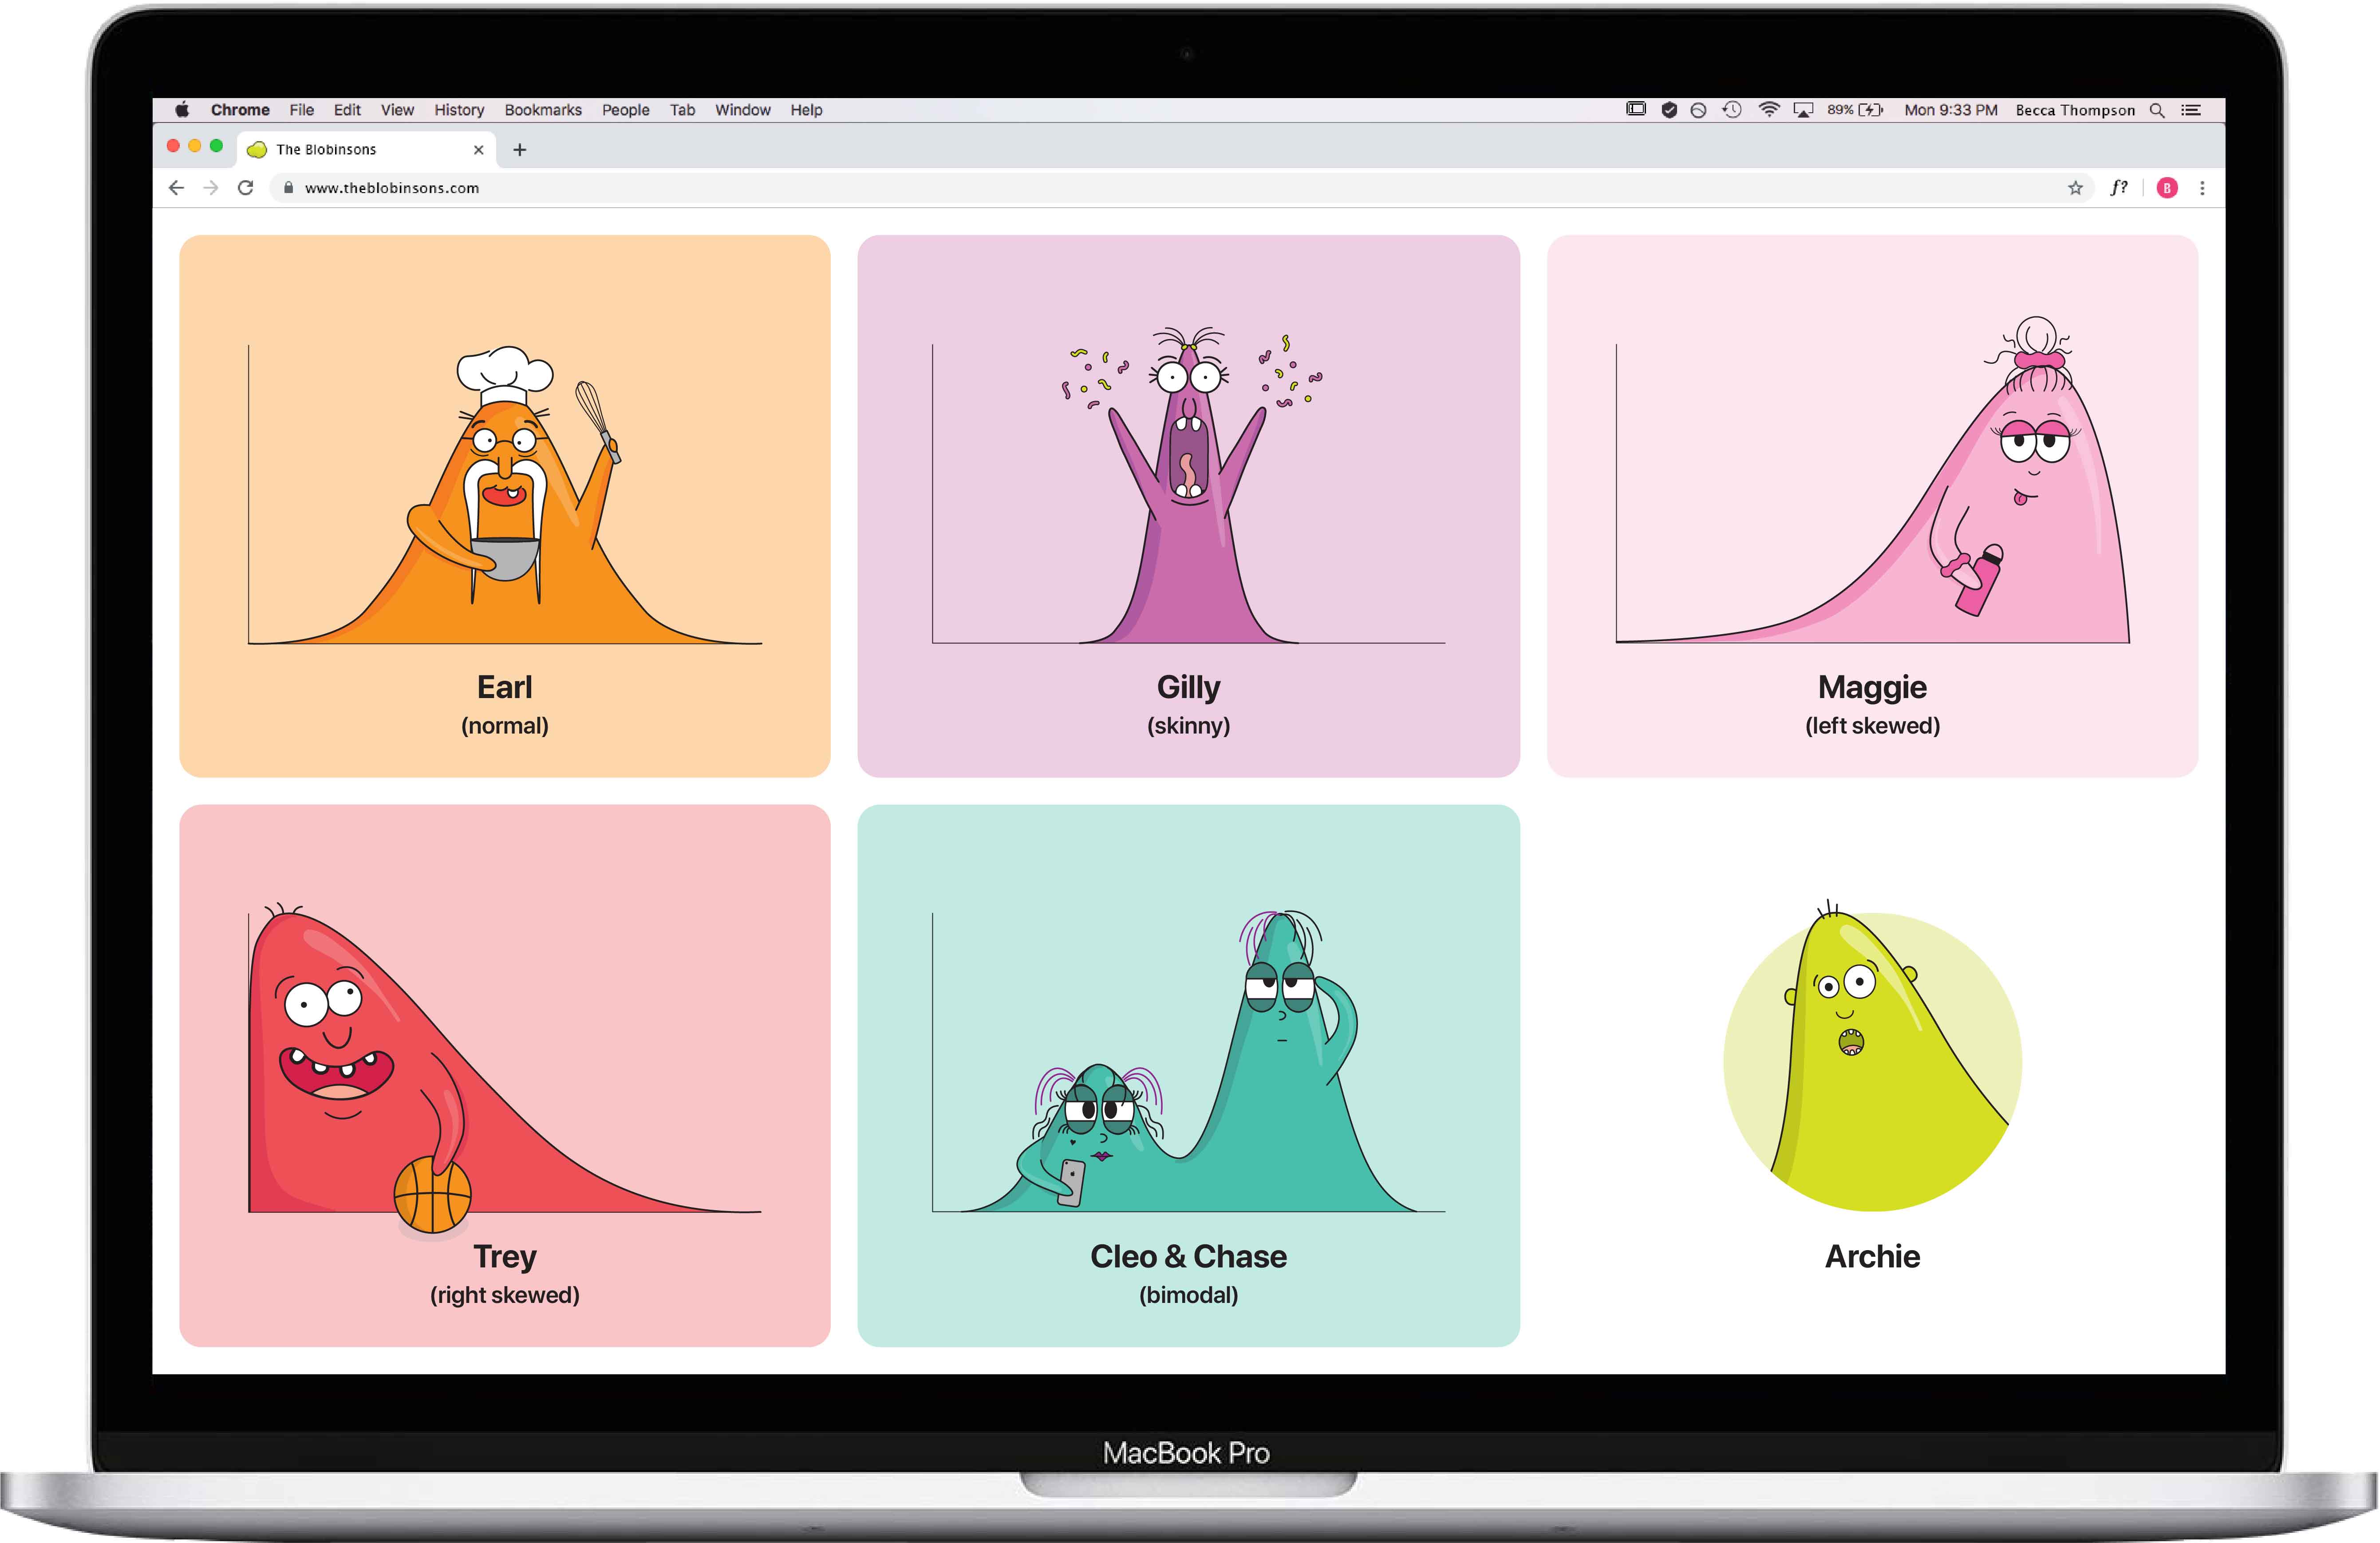
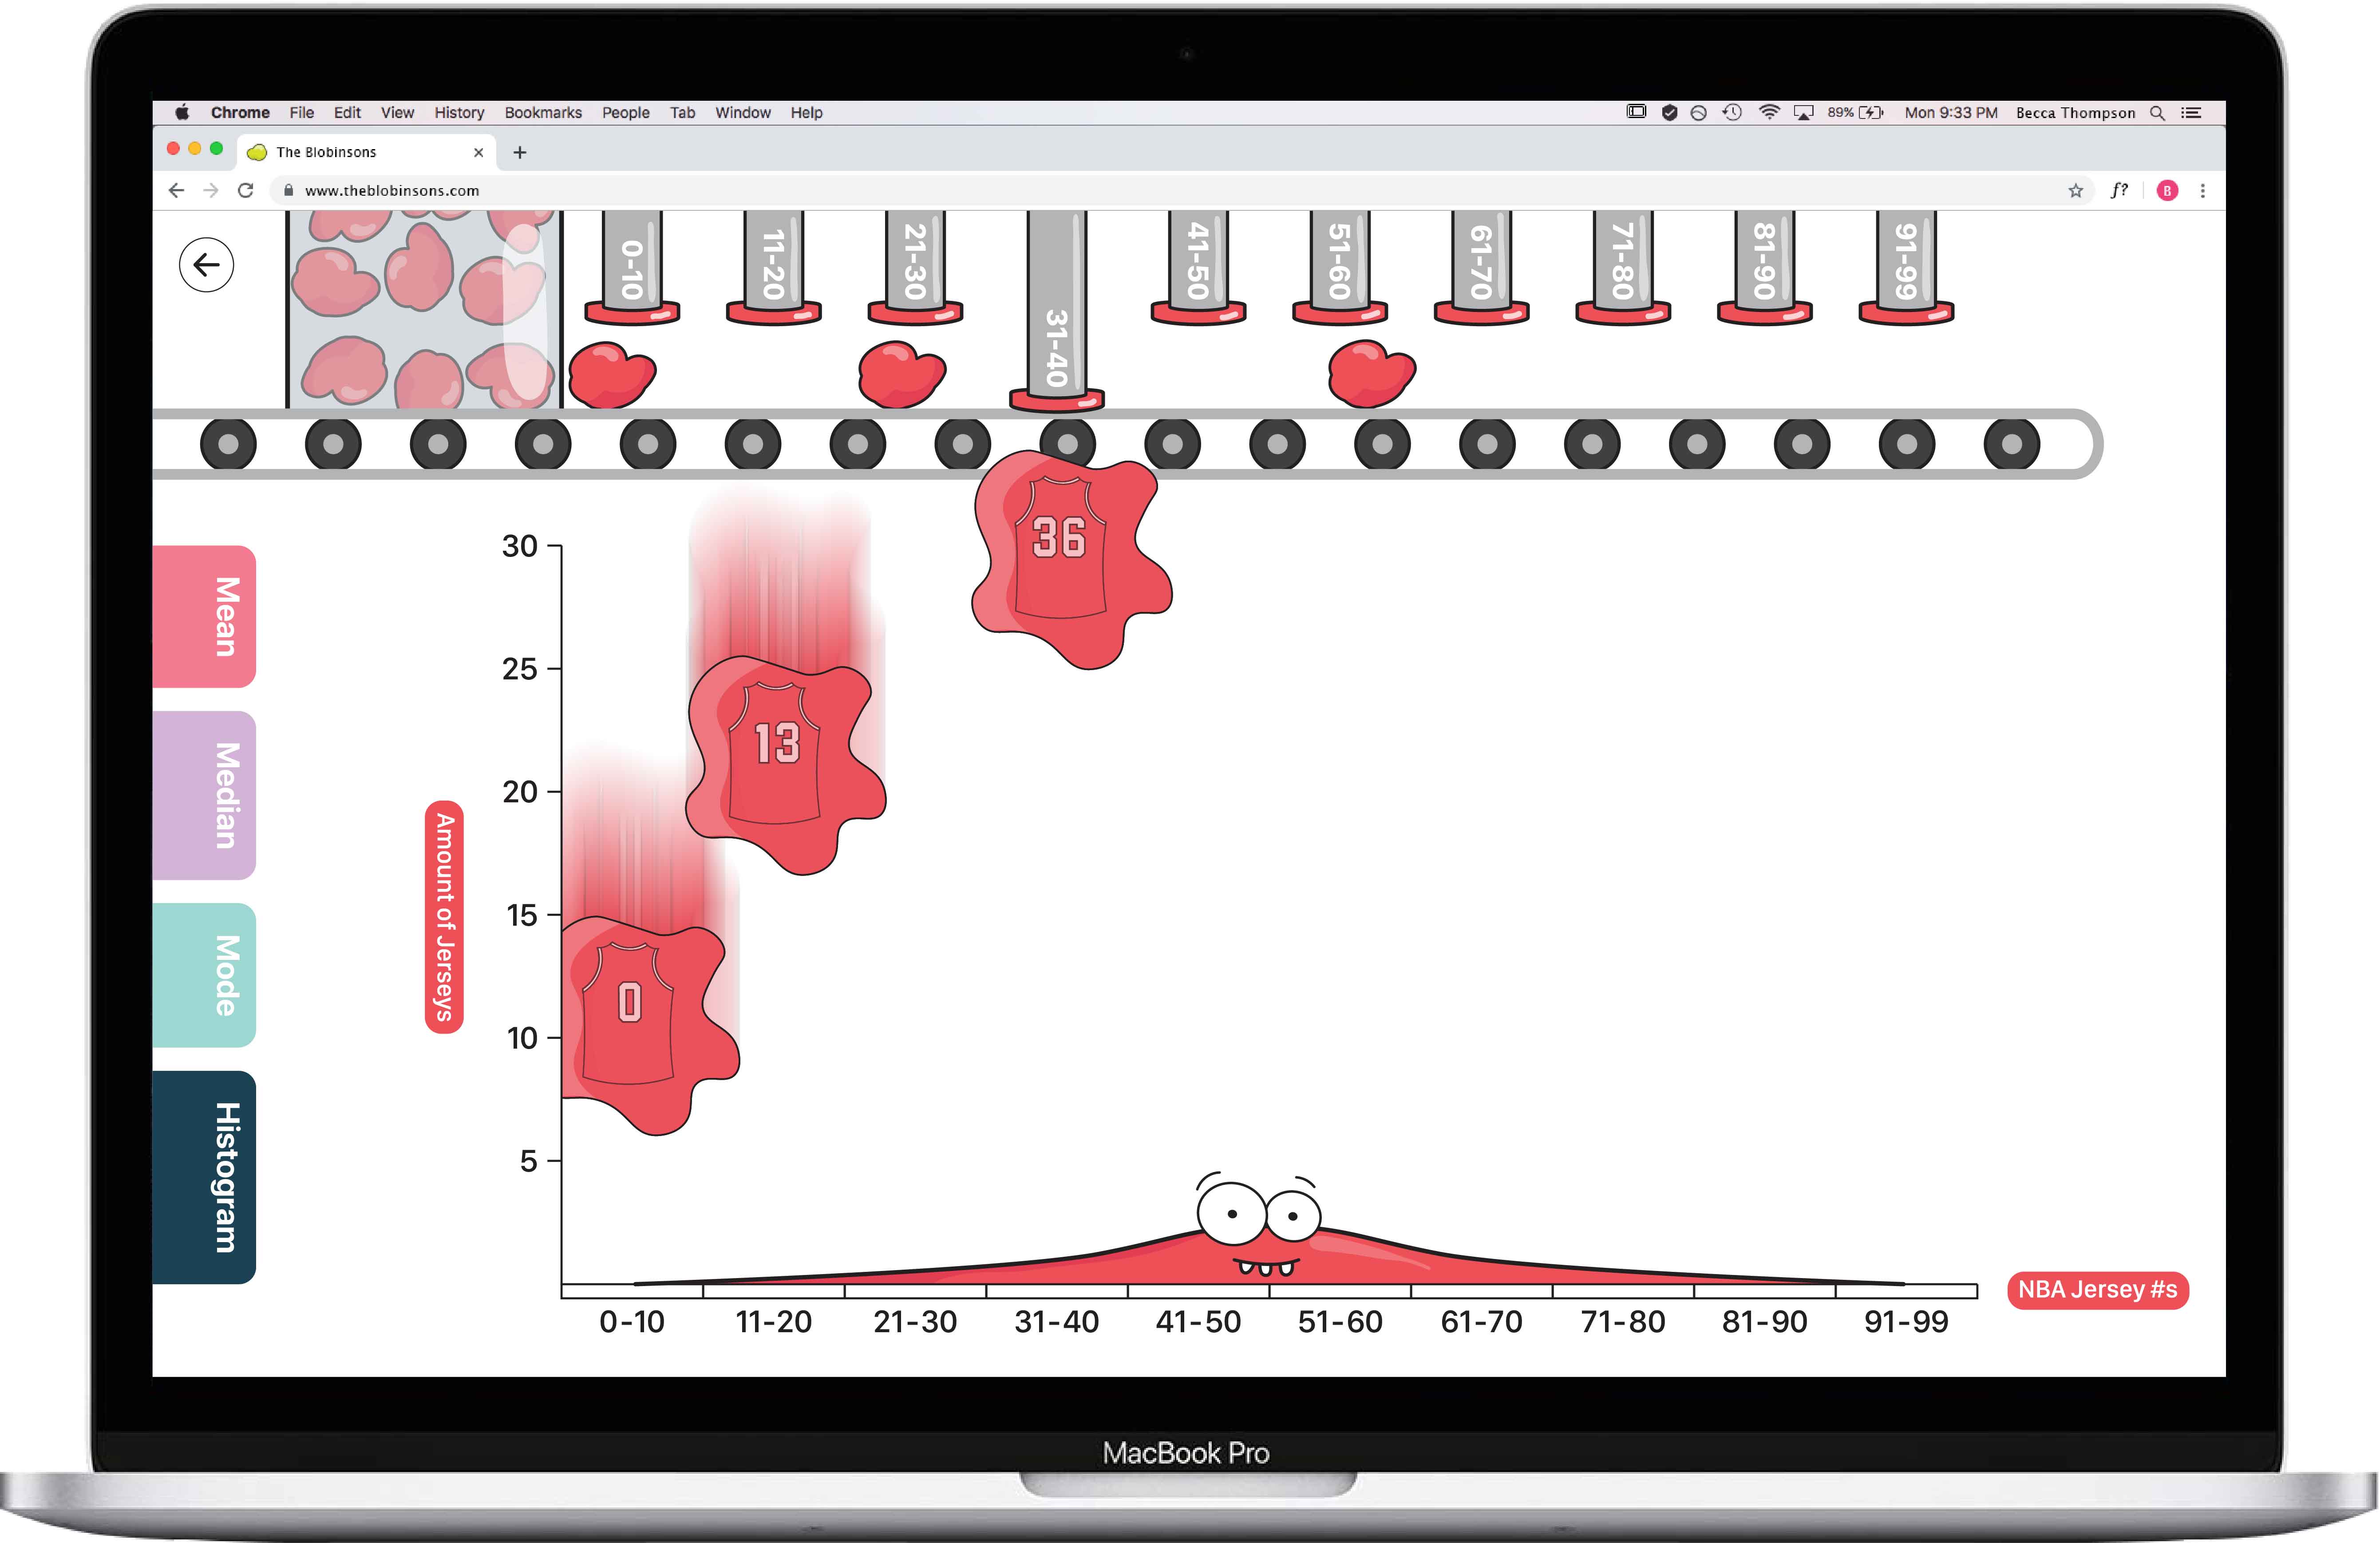
When middle schoolers first access our tool, they are taken through an onboarding stage to help them learn the basics of distribution. In this stage, they will meet Archie and be asked to add data points to him to see how his distribution changes.

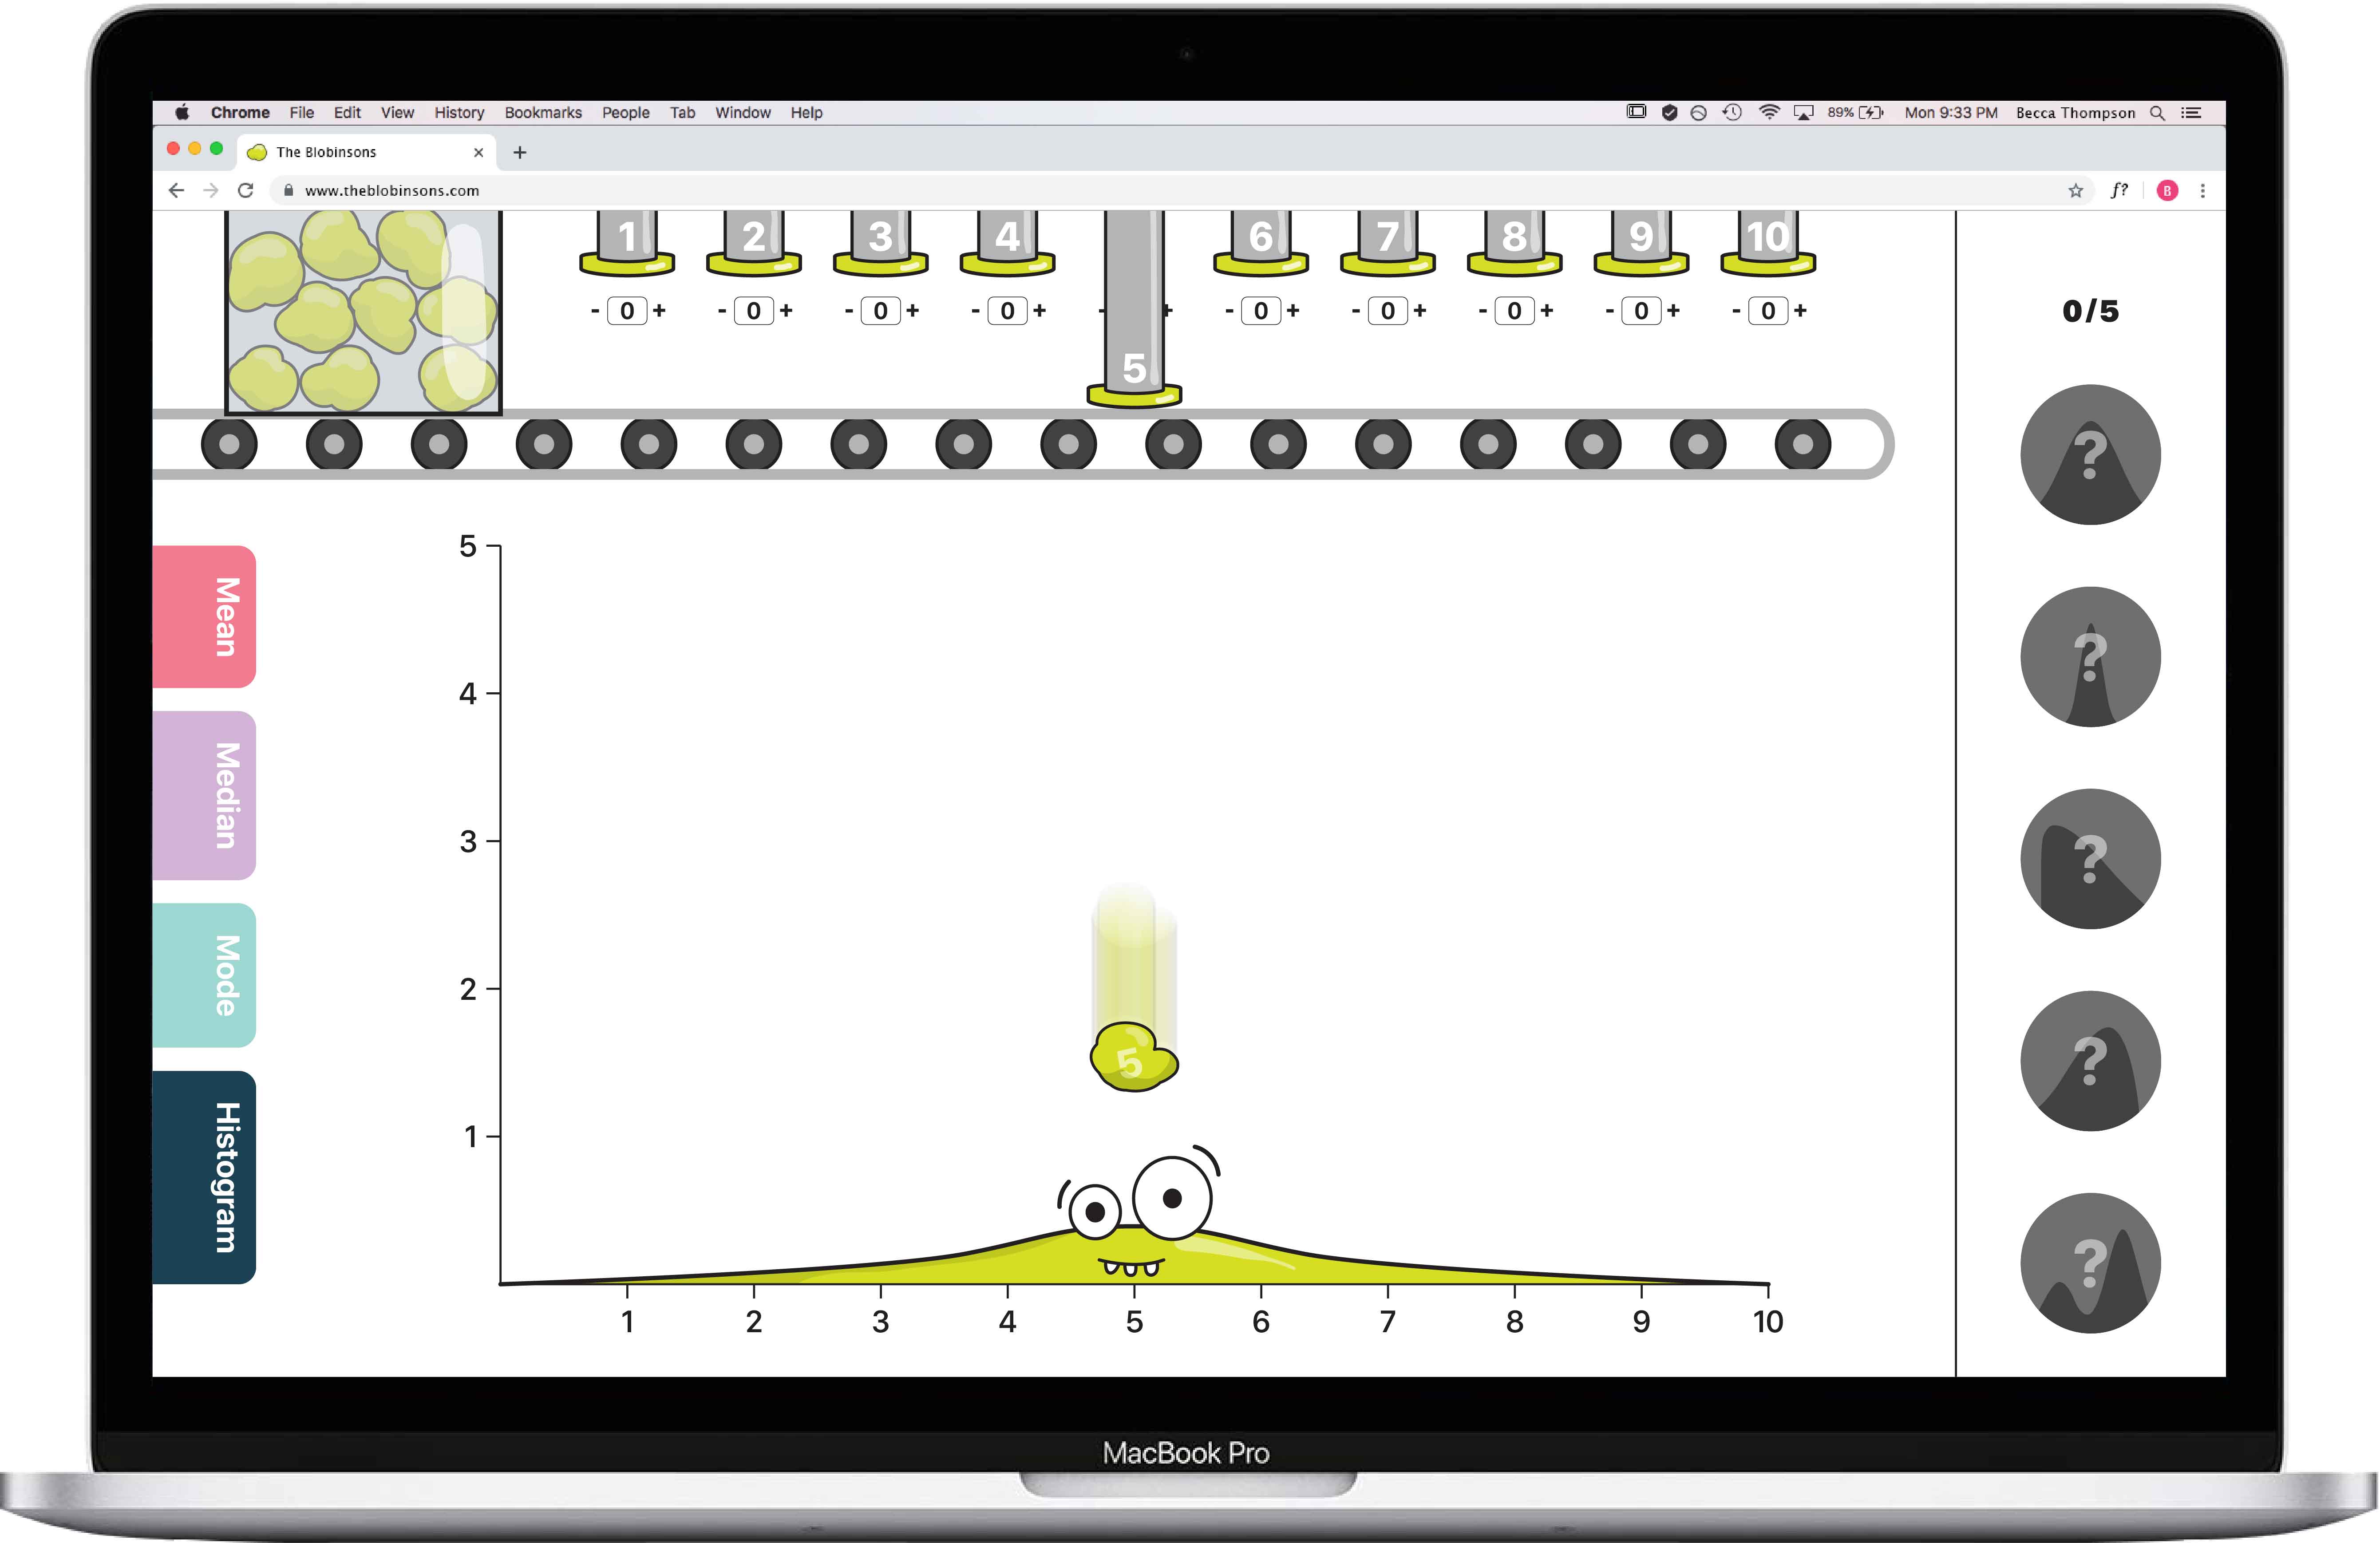
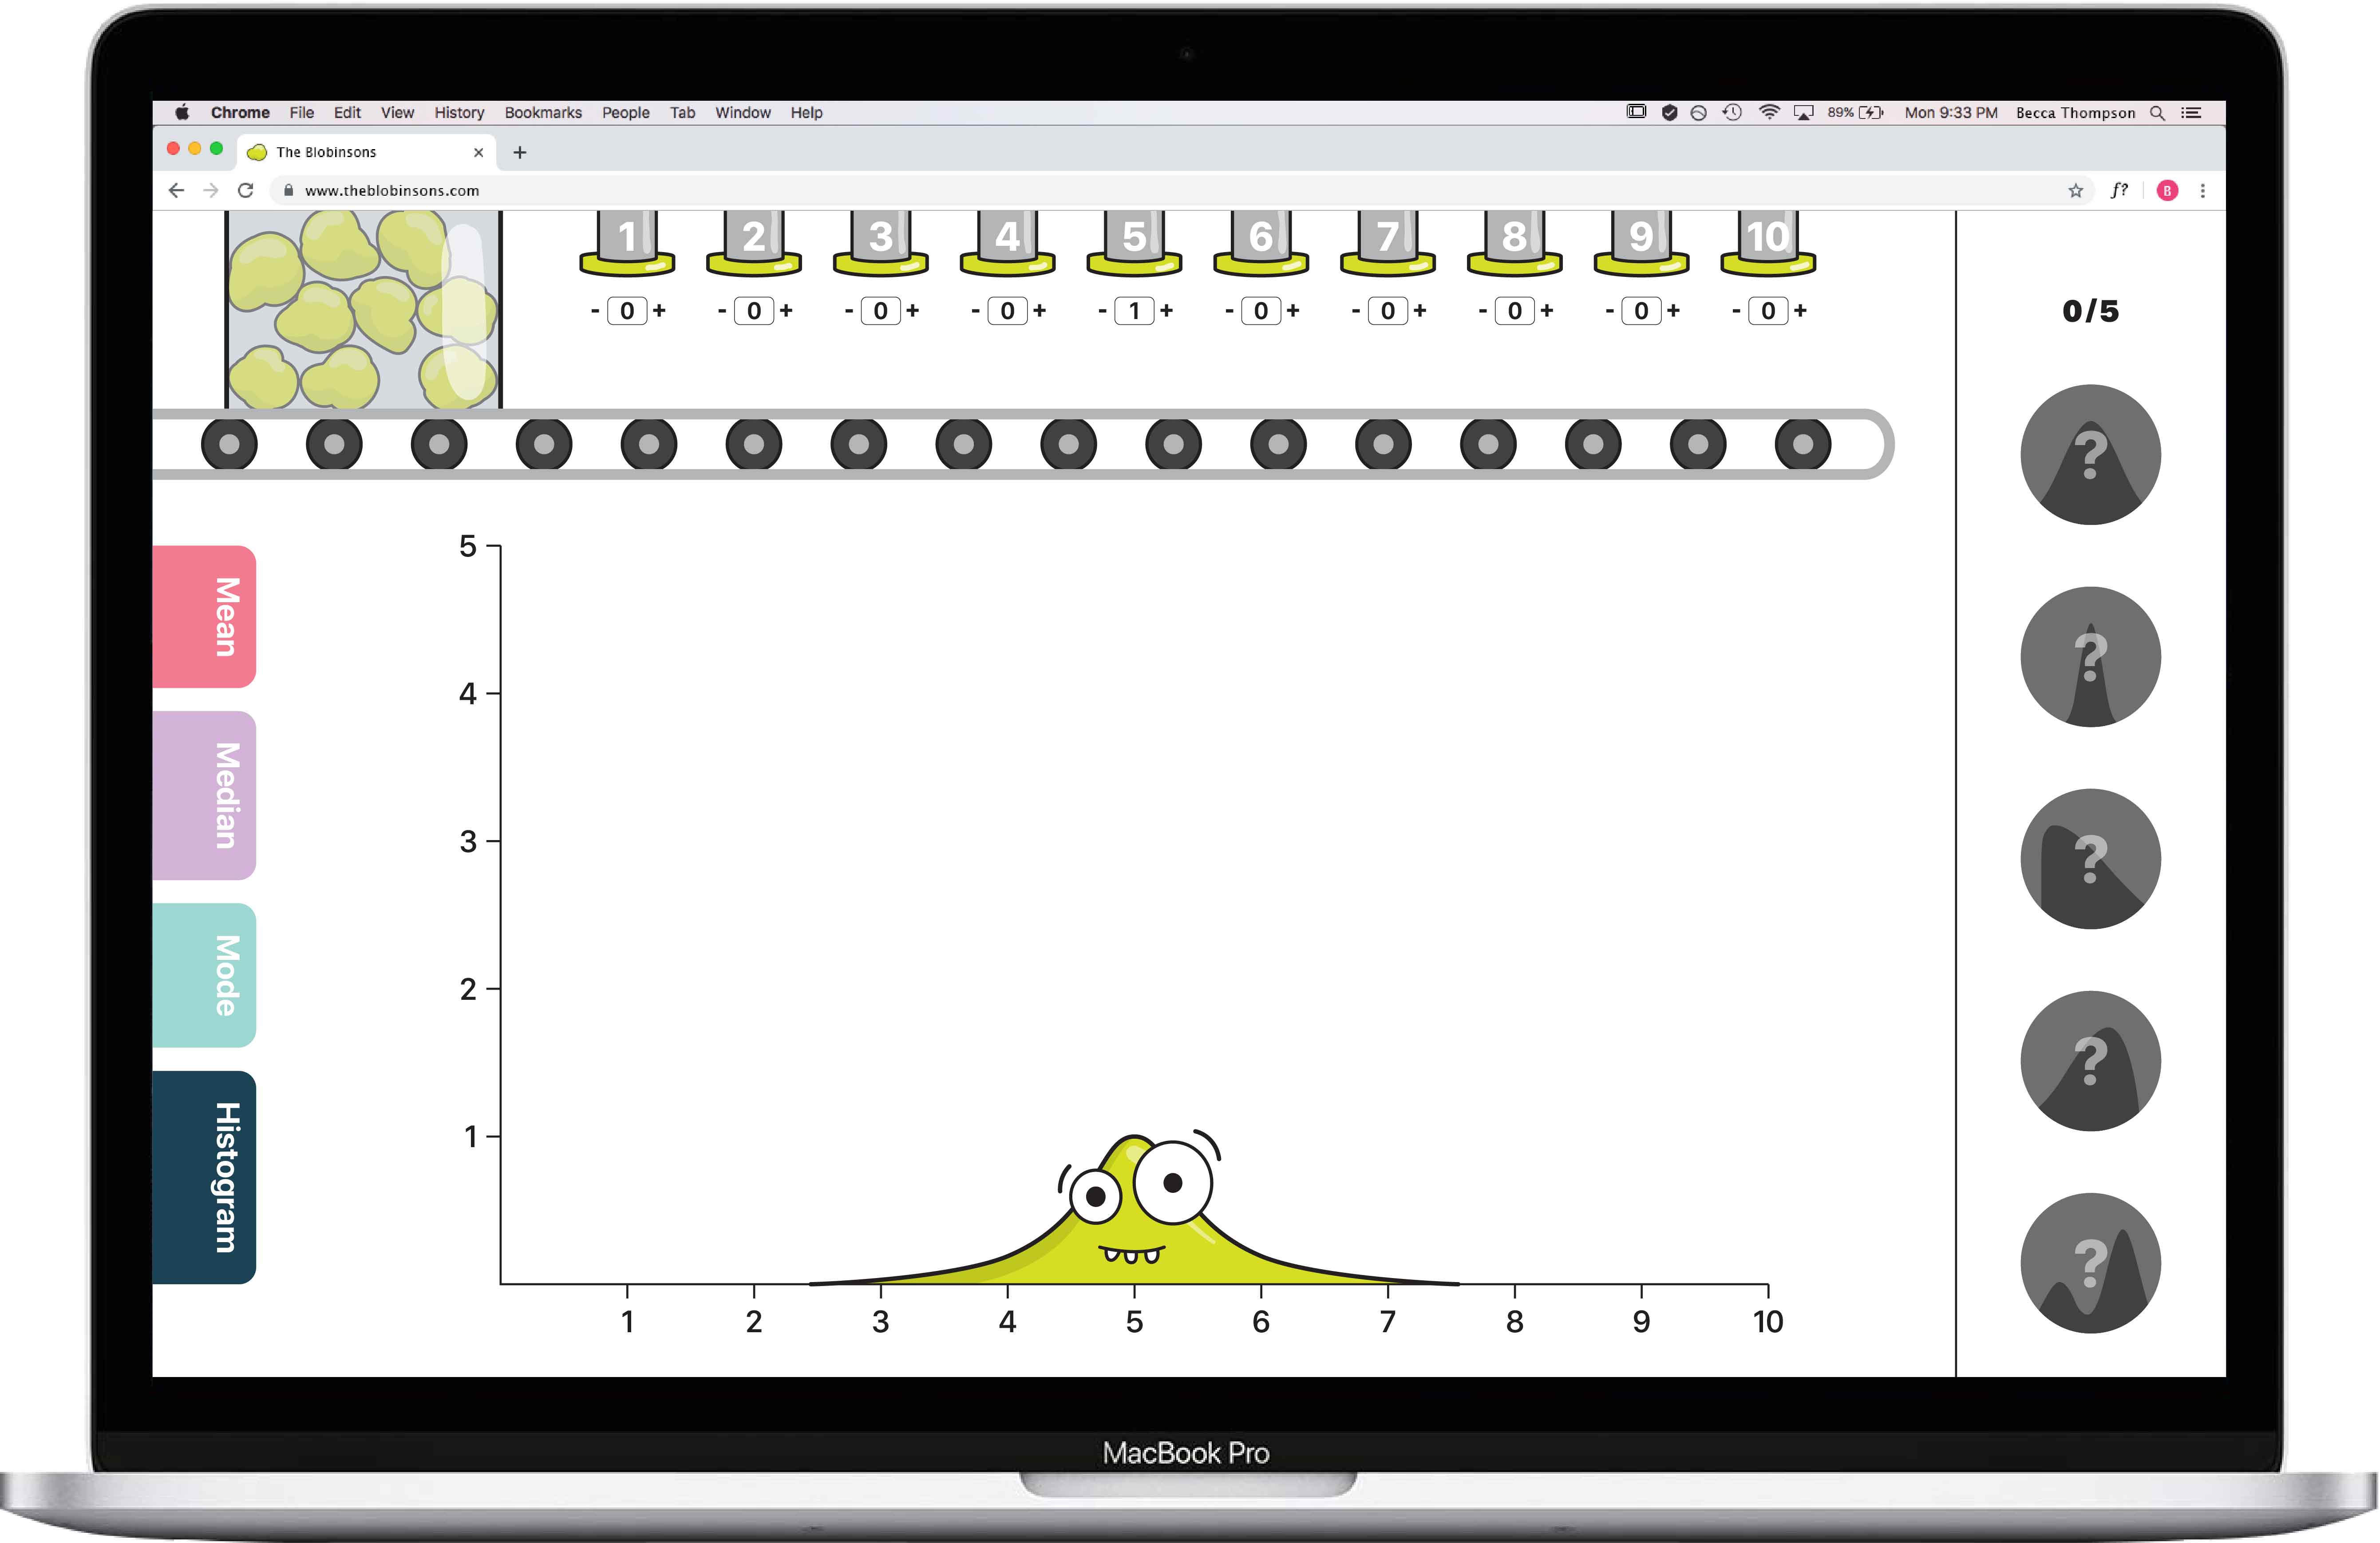
As middle schoolers add data points, they will complete Archie’s data set—unlocking one of his family members.
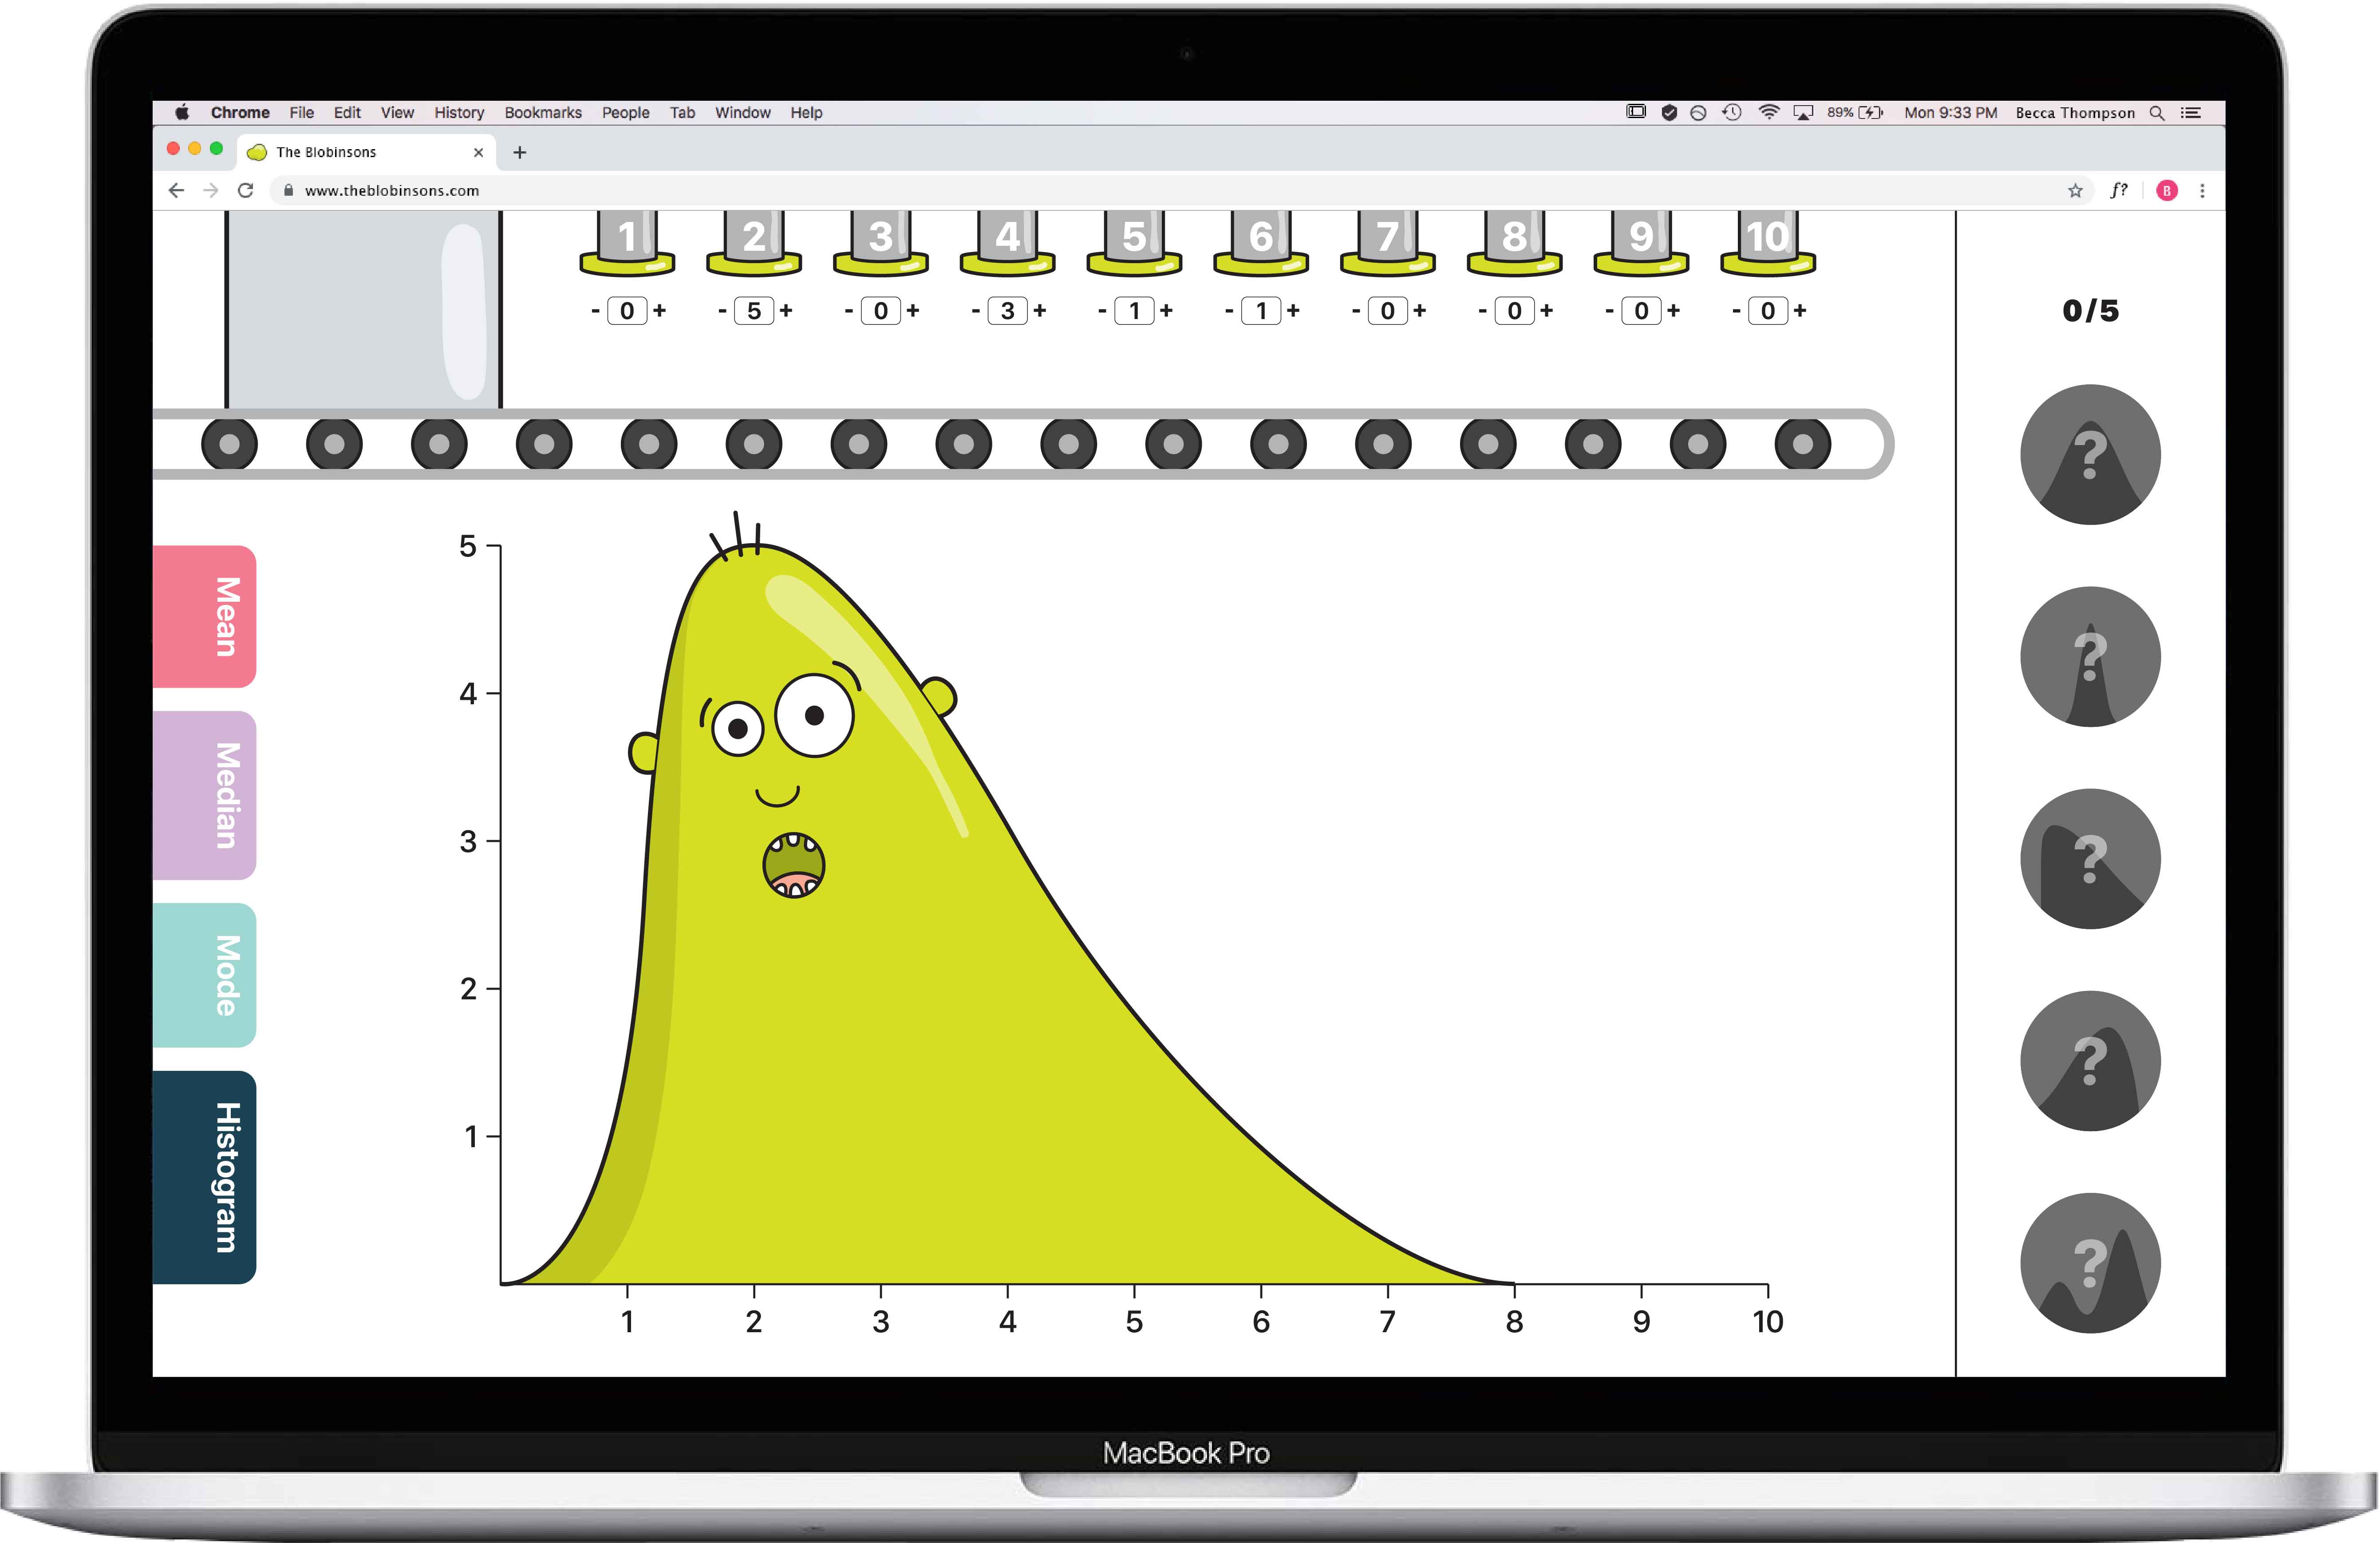
To complete the onboarding stage, middle schoolers must unlock the rest of Archie’s family members. They can do so by adding and subtracting data points from Archie to make his shape match the shape of the rest of his family members.
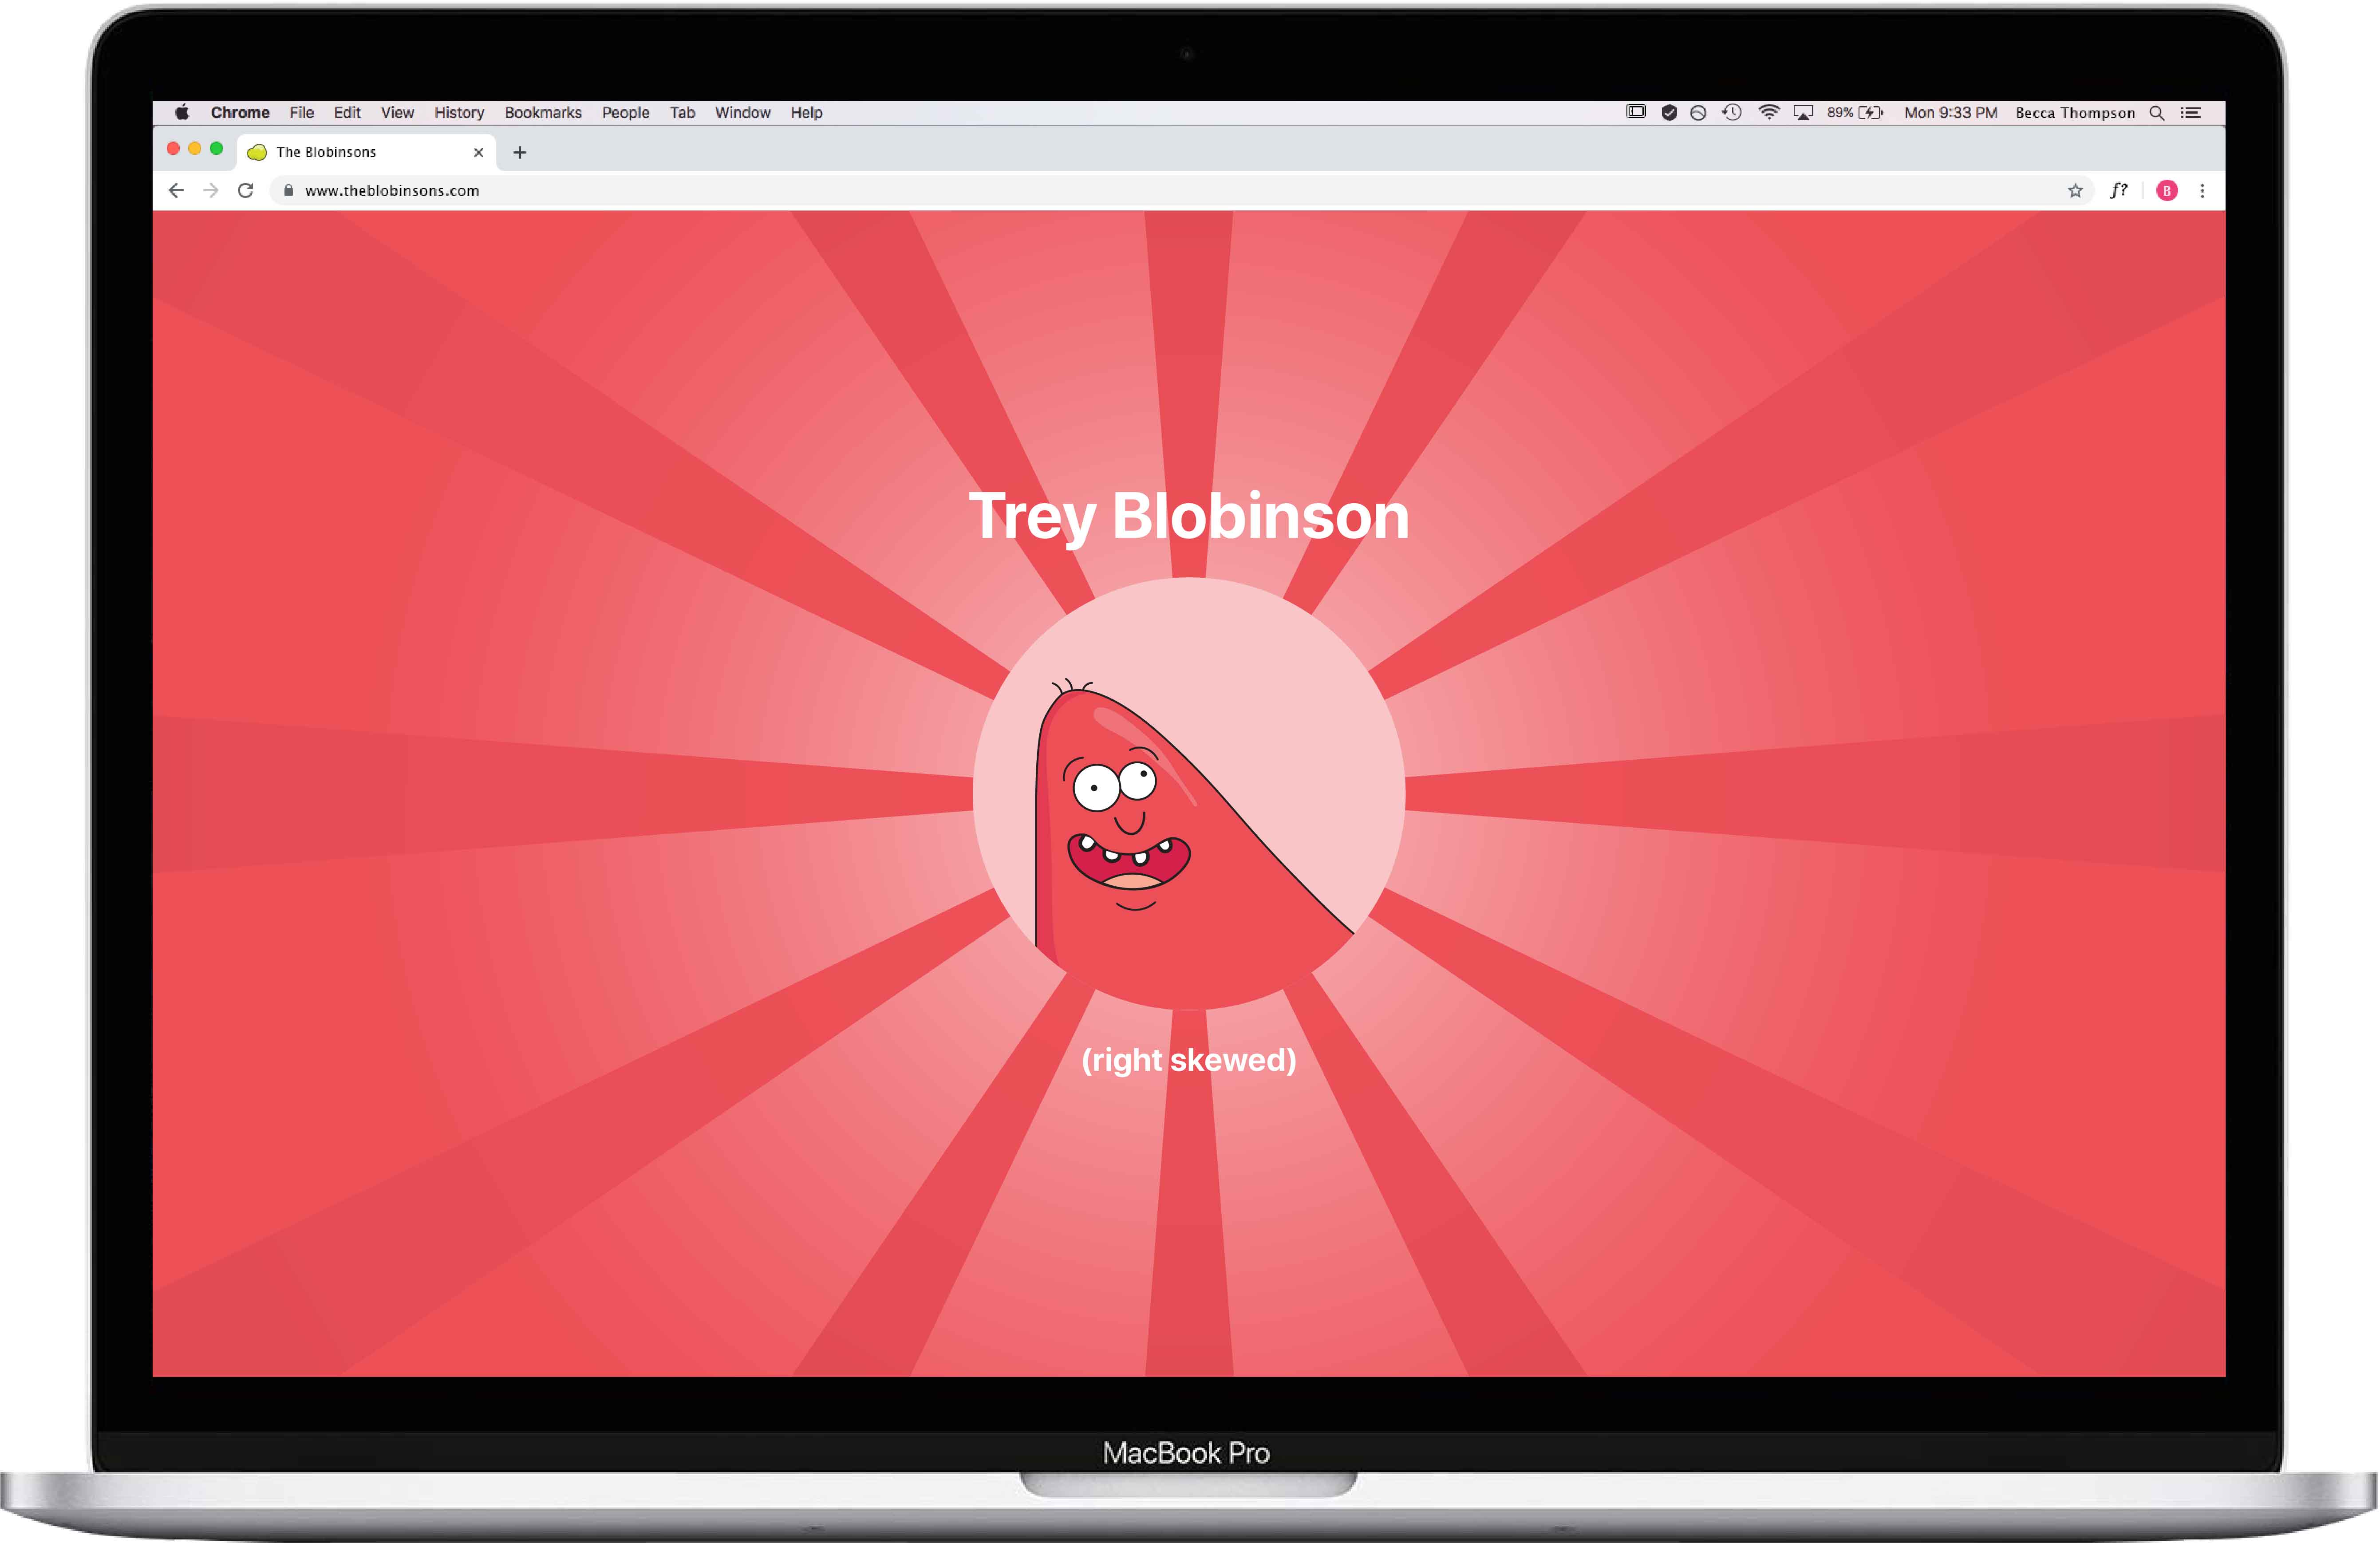
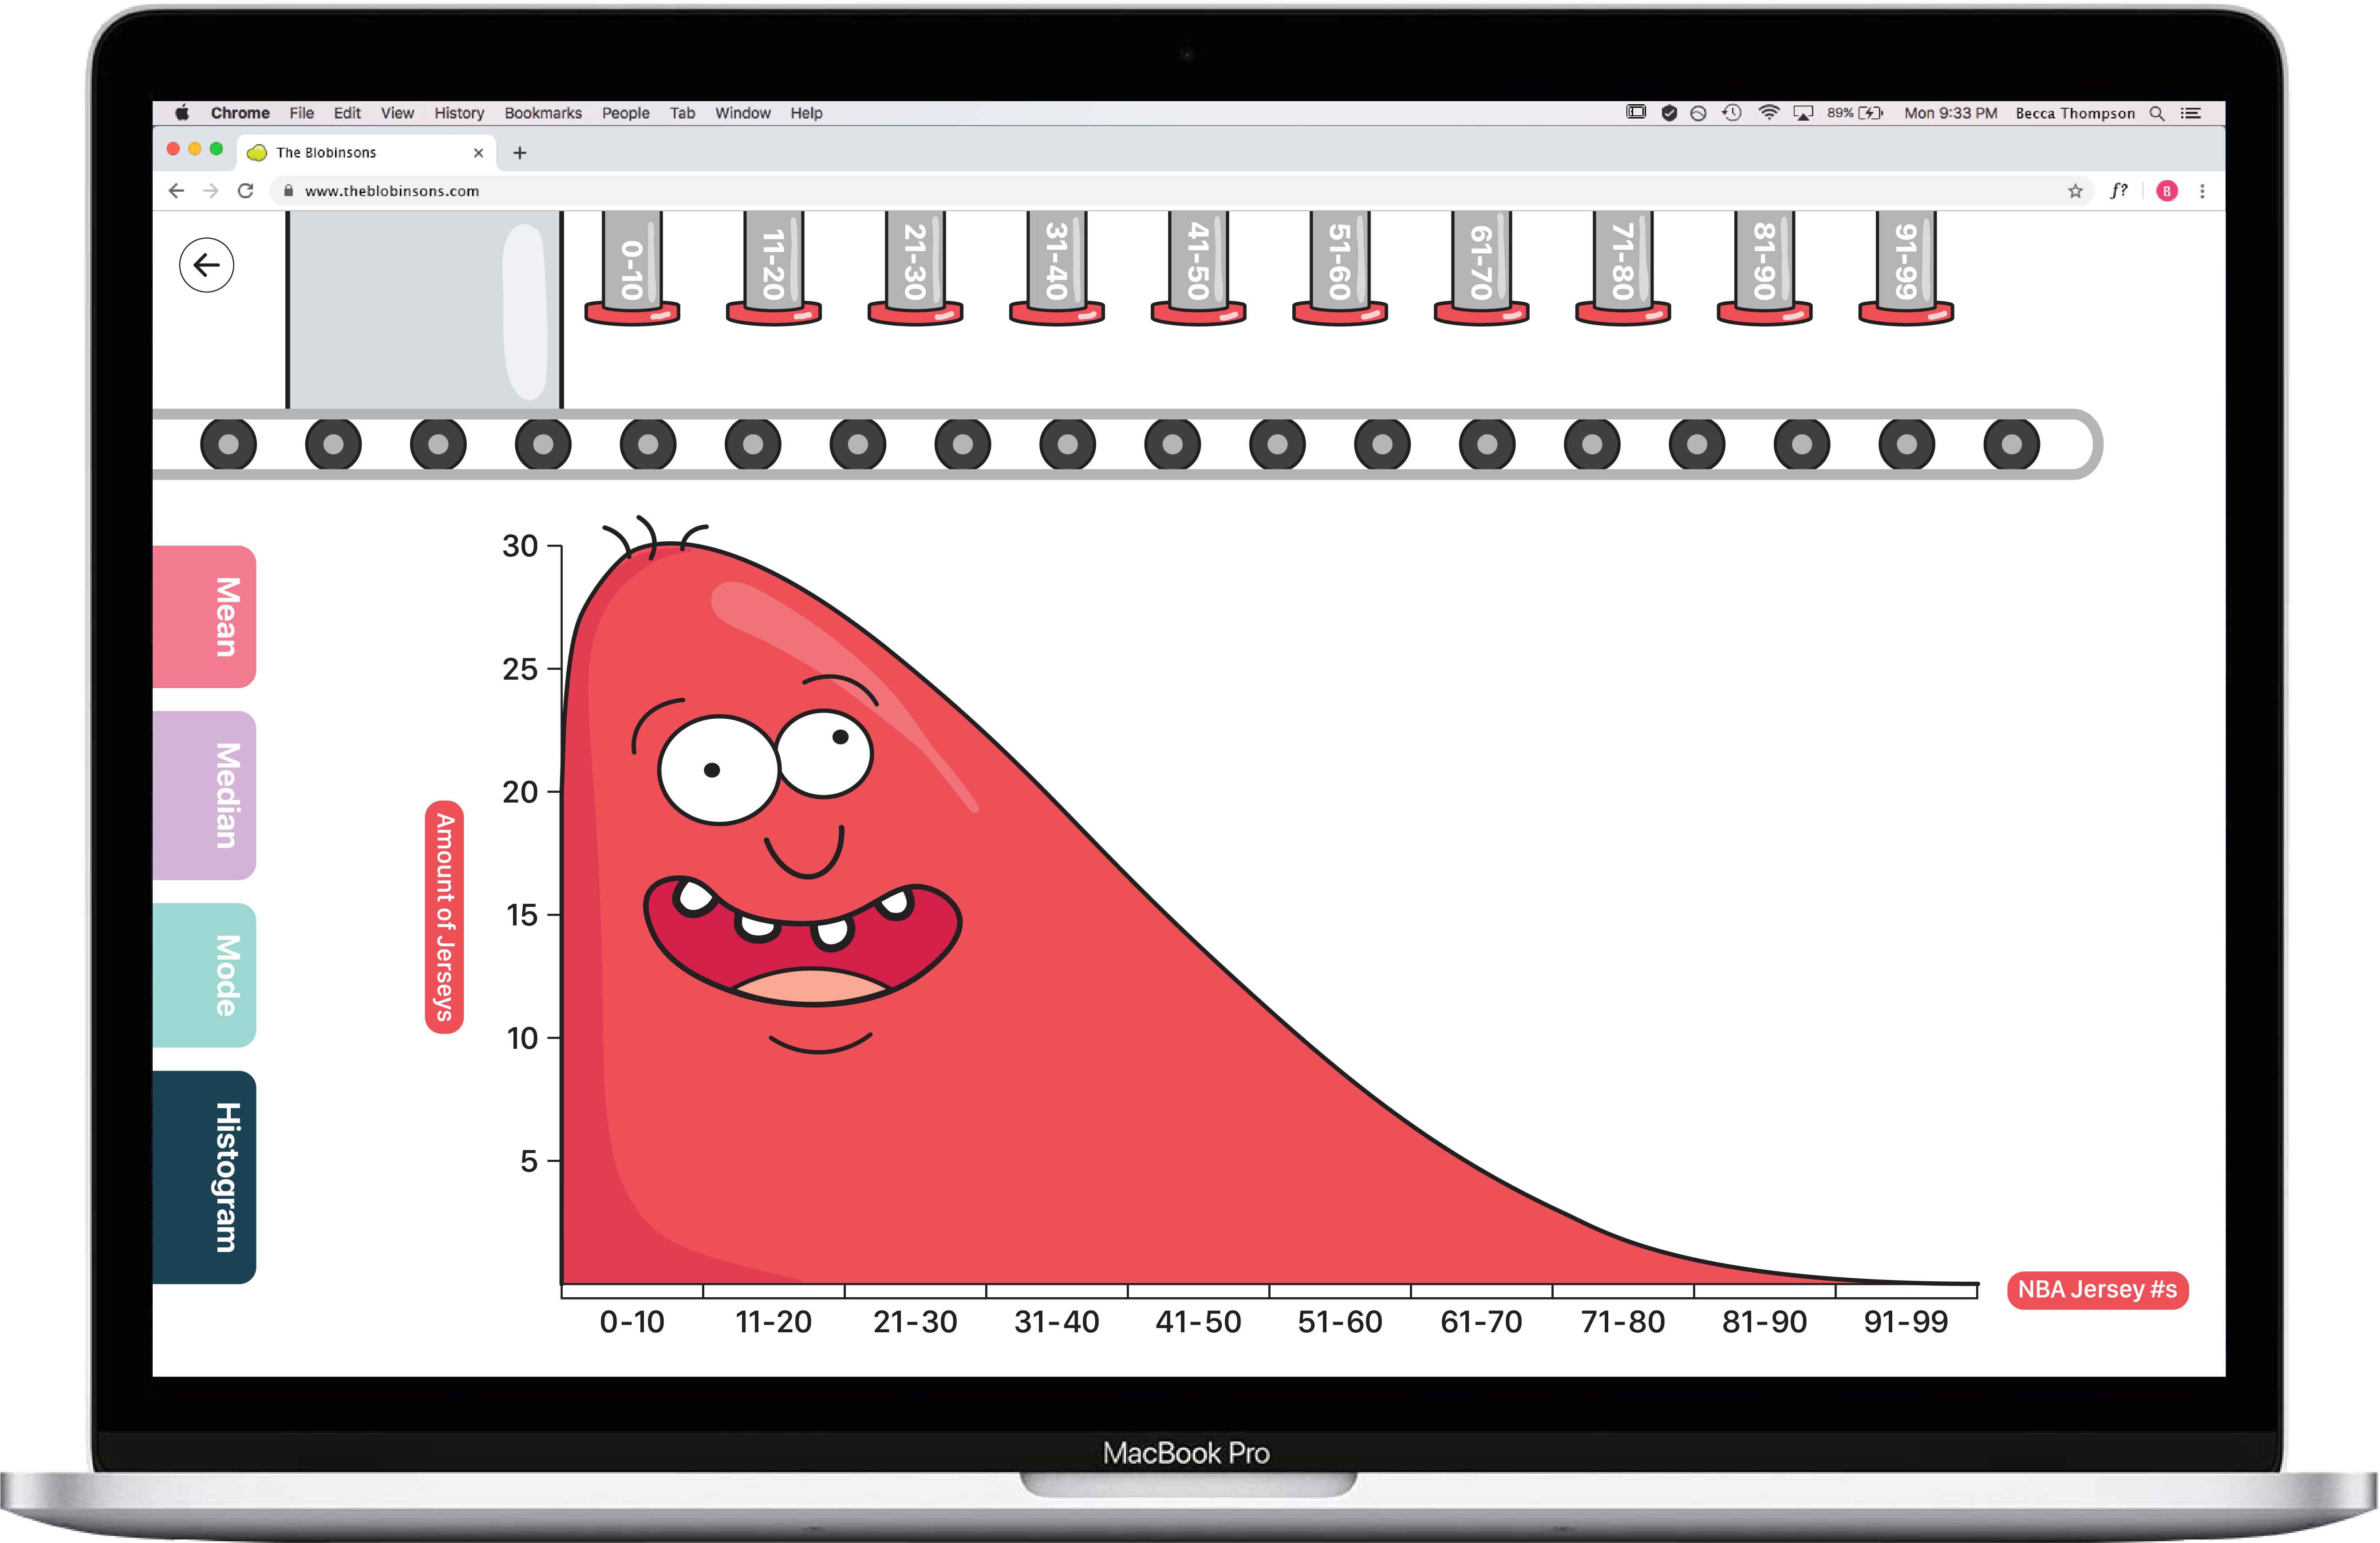
Once a student unlocks the rest of the family members, they will be taken to a screen where they can choose to interact with one. Each family member represents a different distribution and a unique data set.
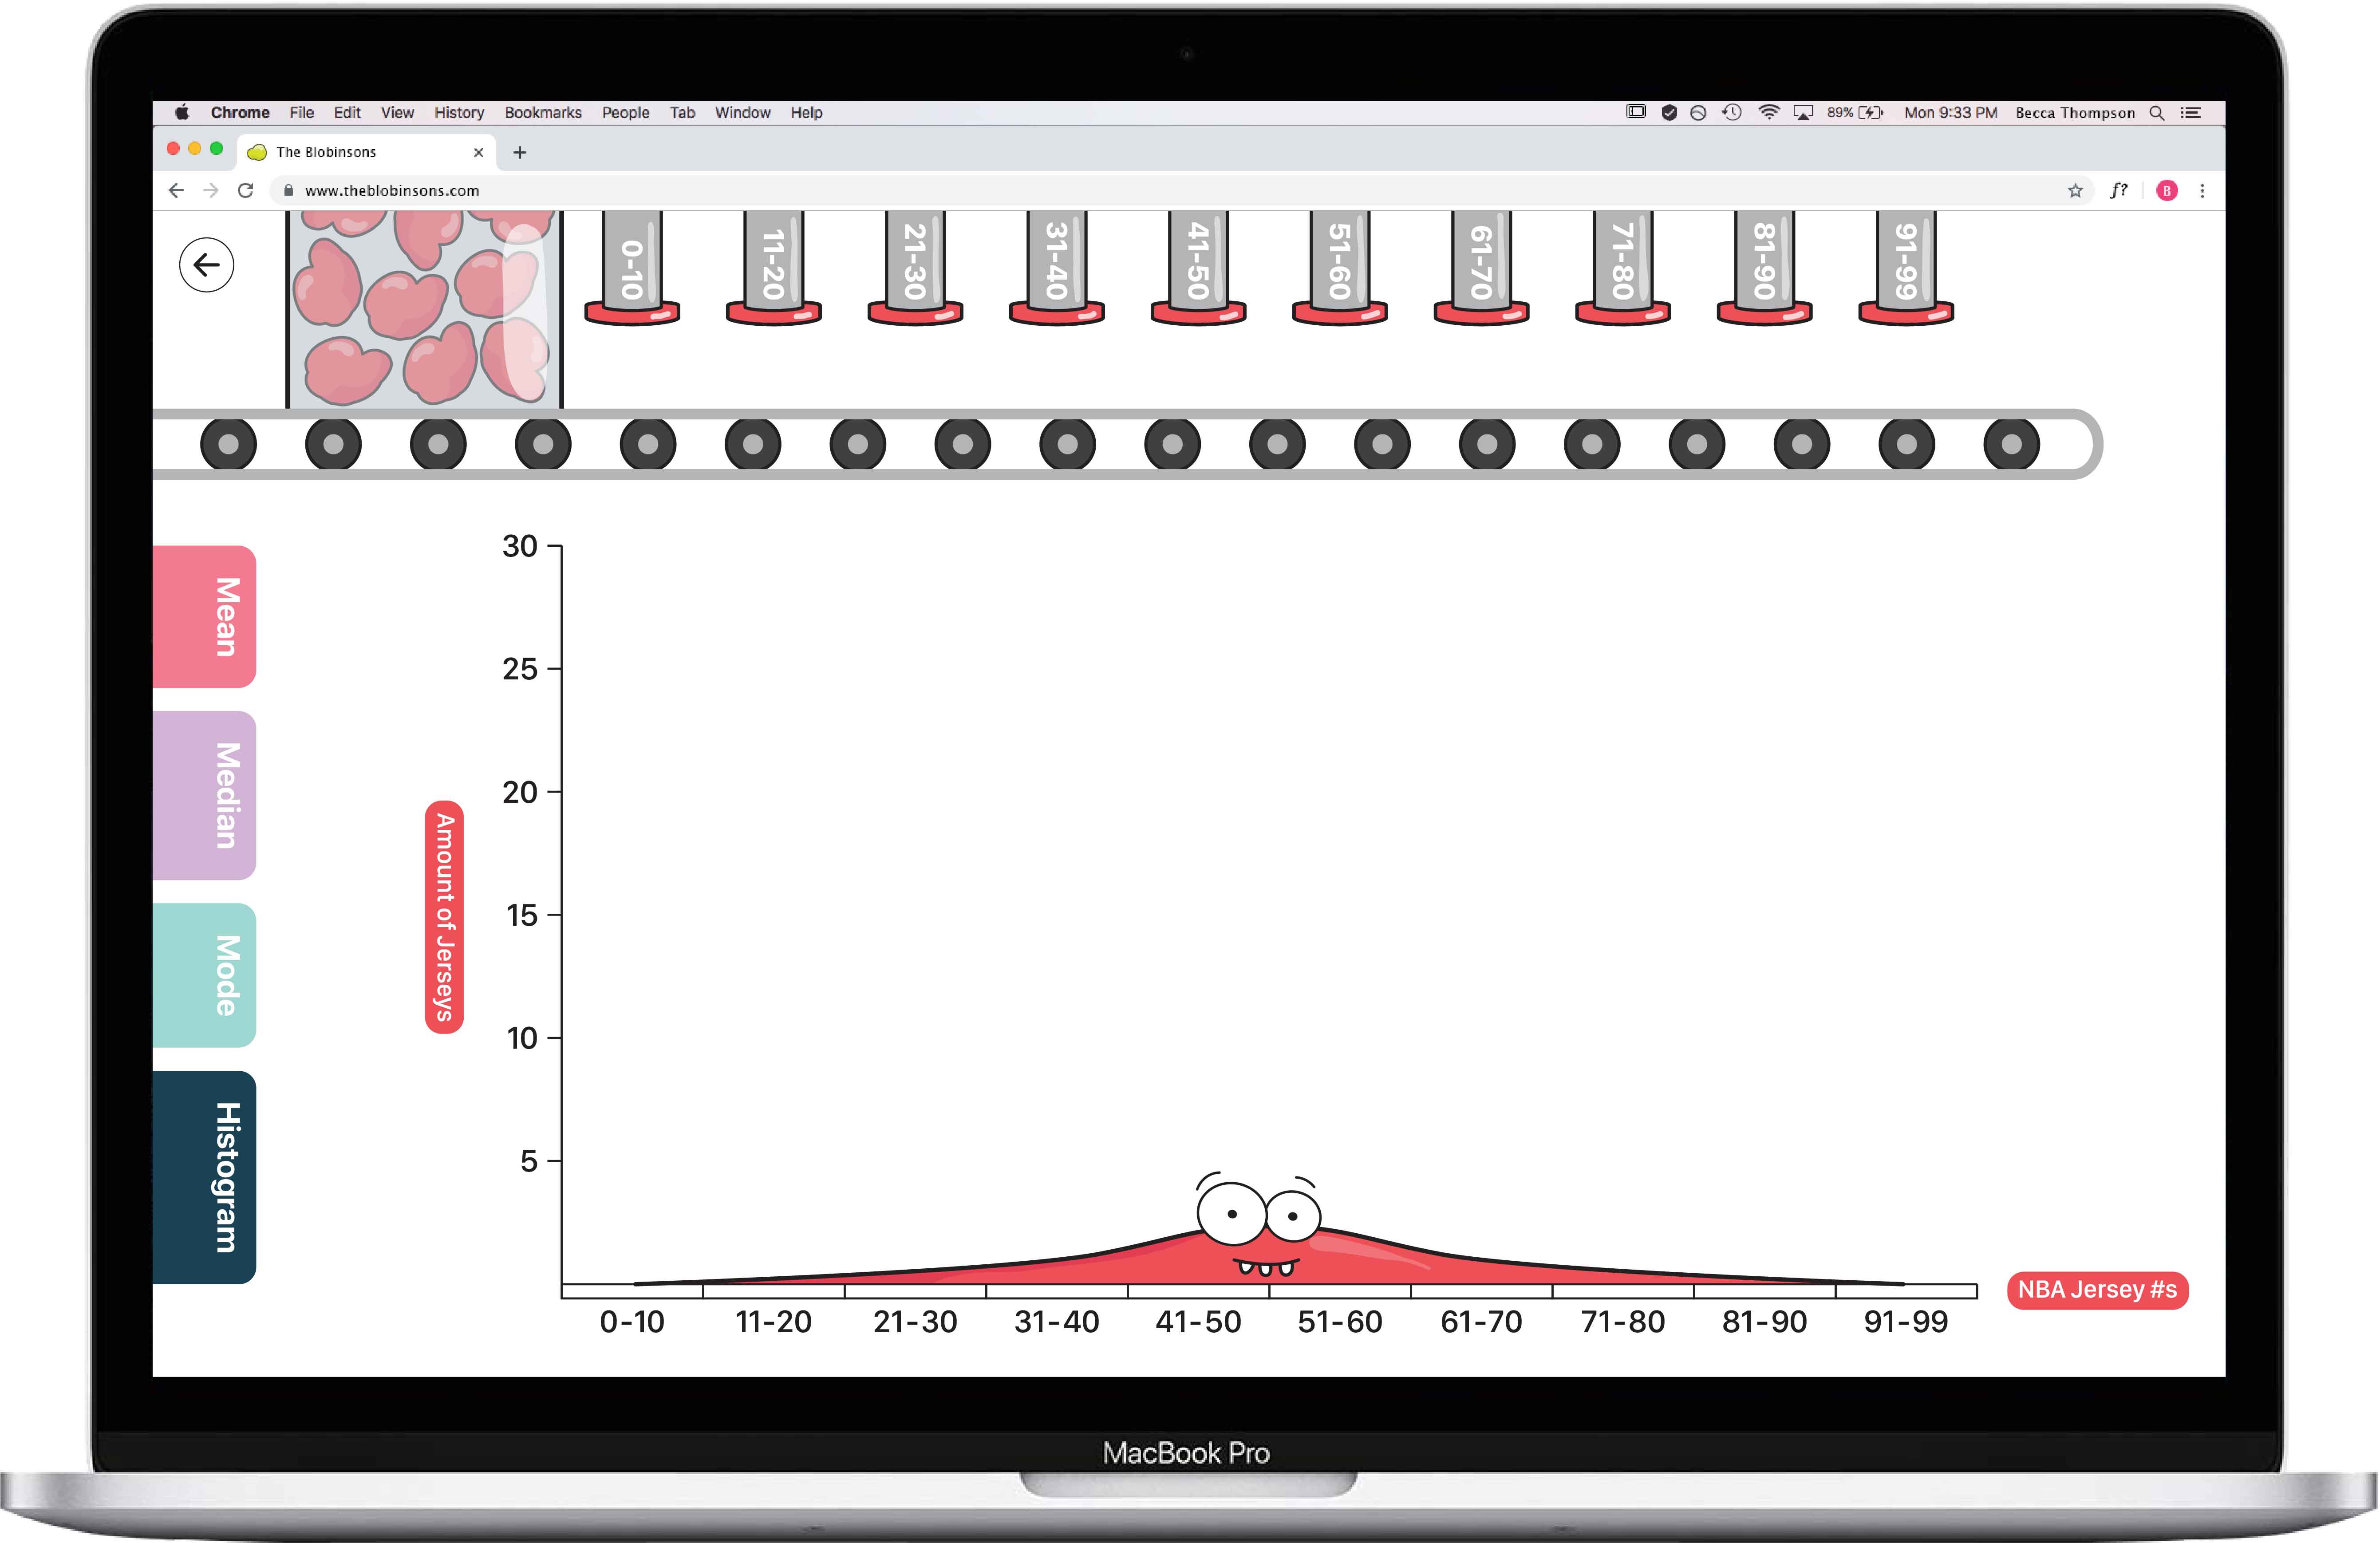
After a student selects a blob, they will be introduced to that blob, as well as the data set it represents. From there, they can watch the data points fall and the blob form.
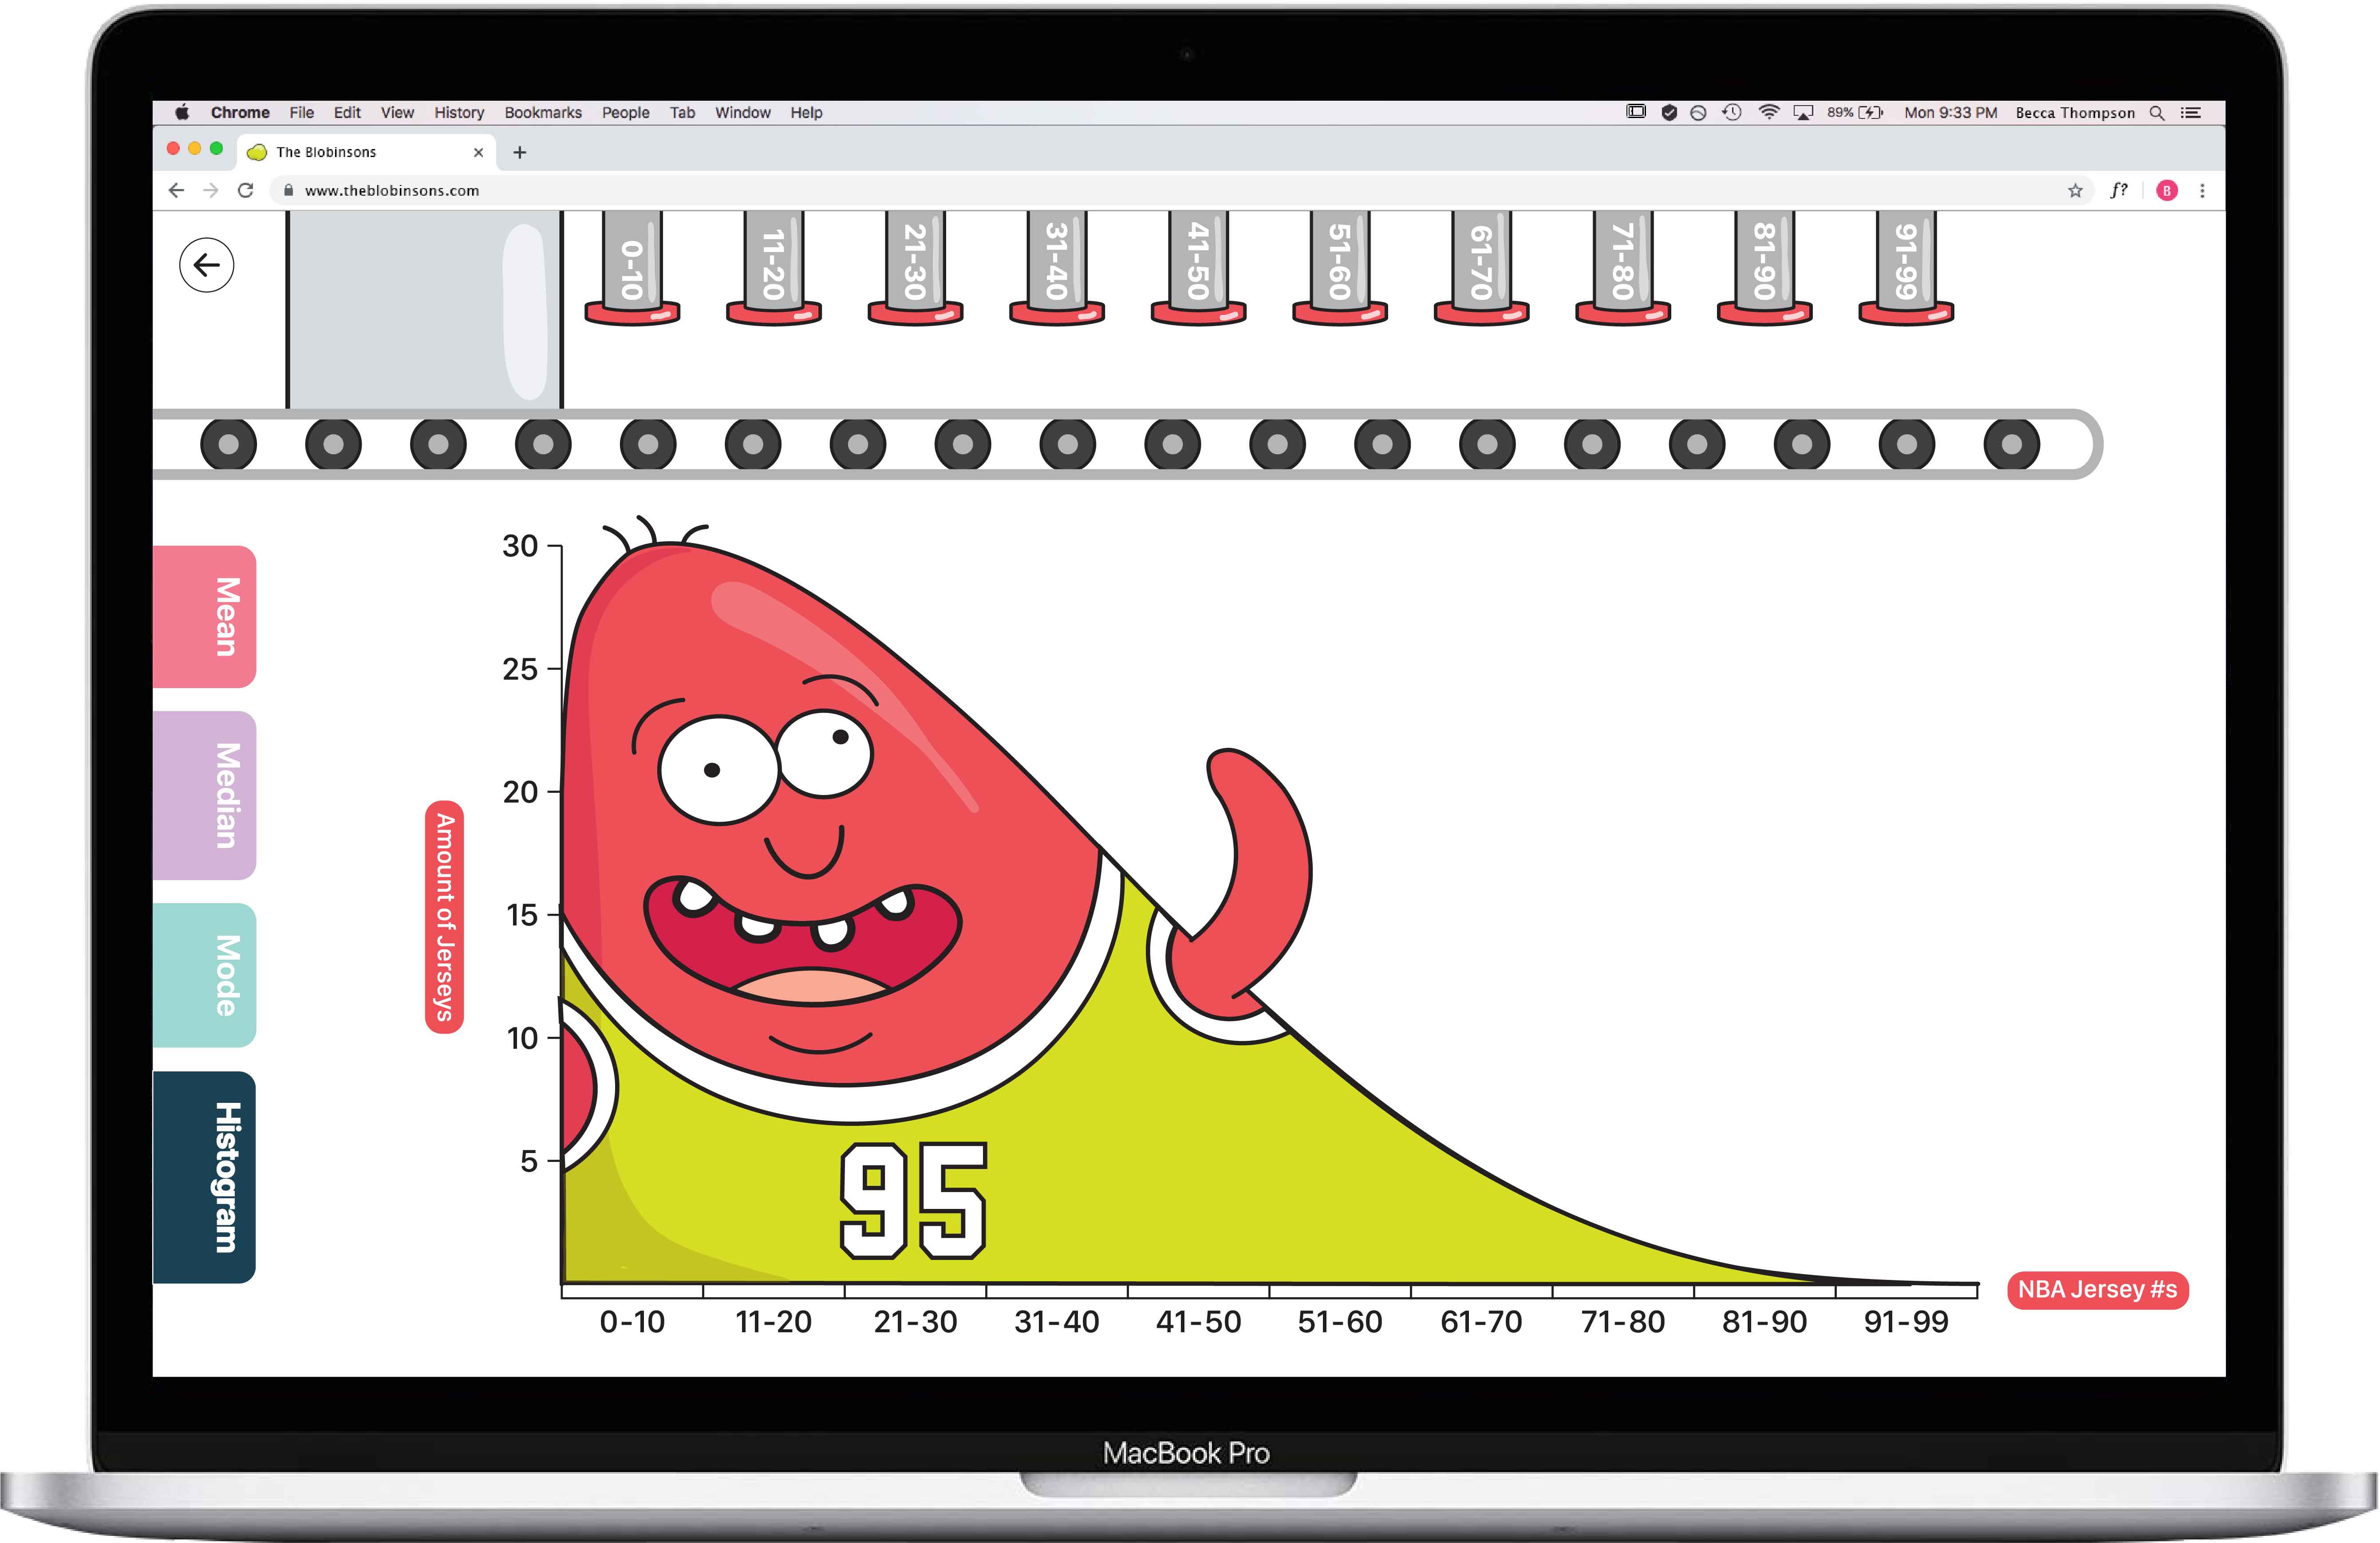
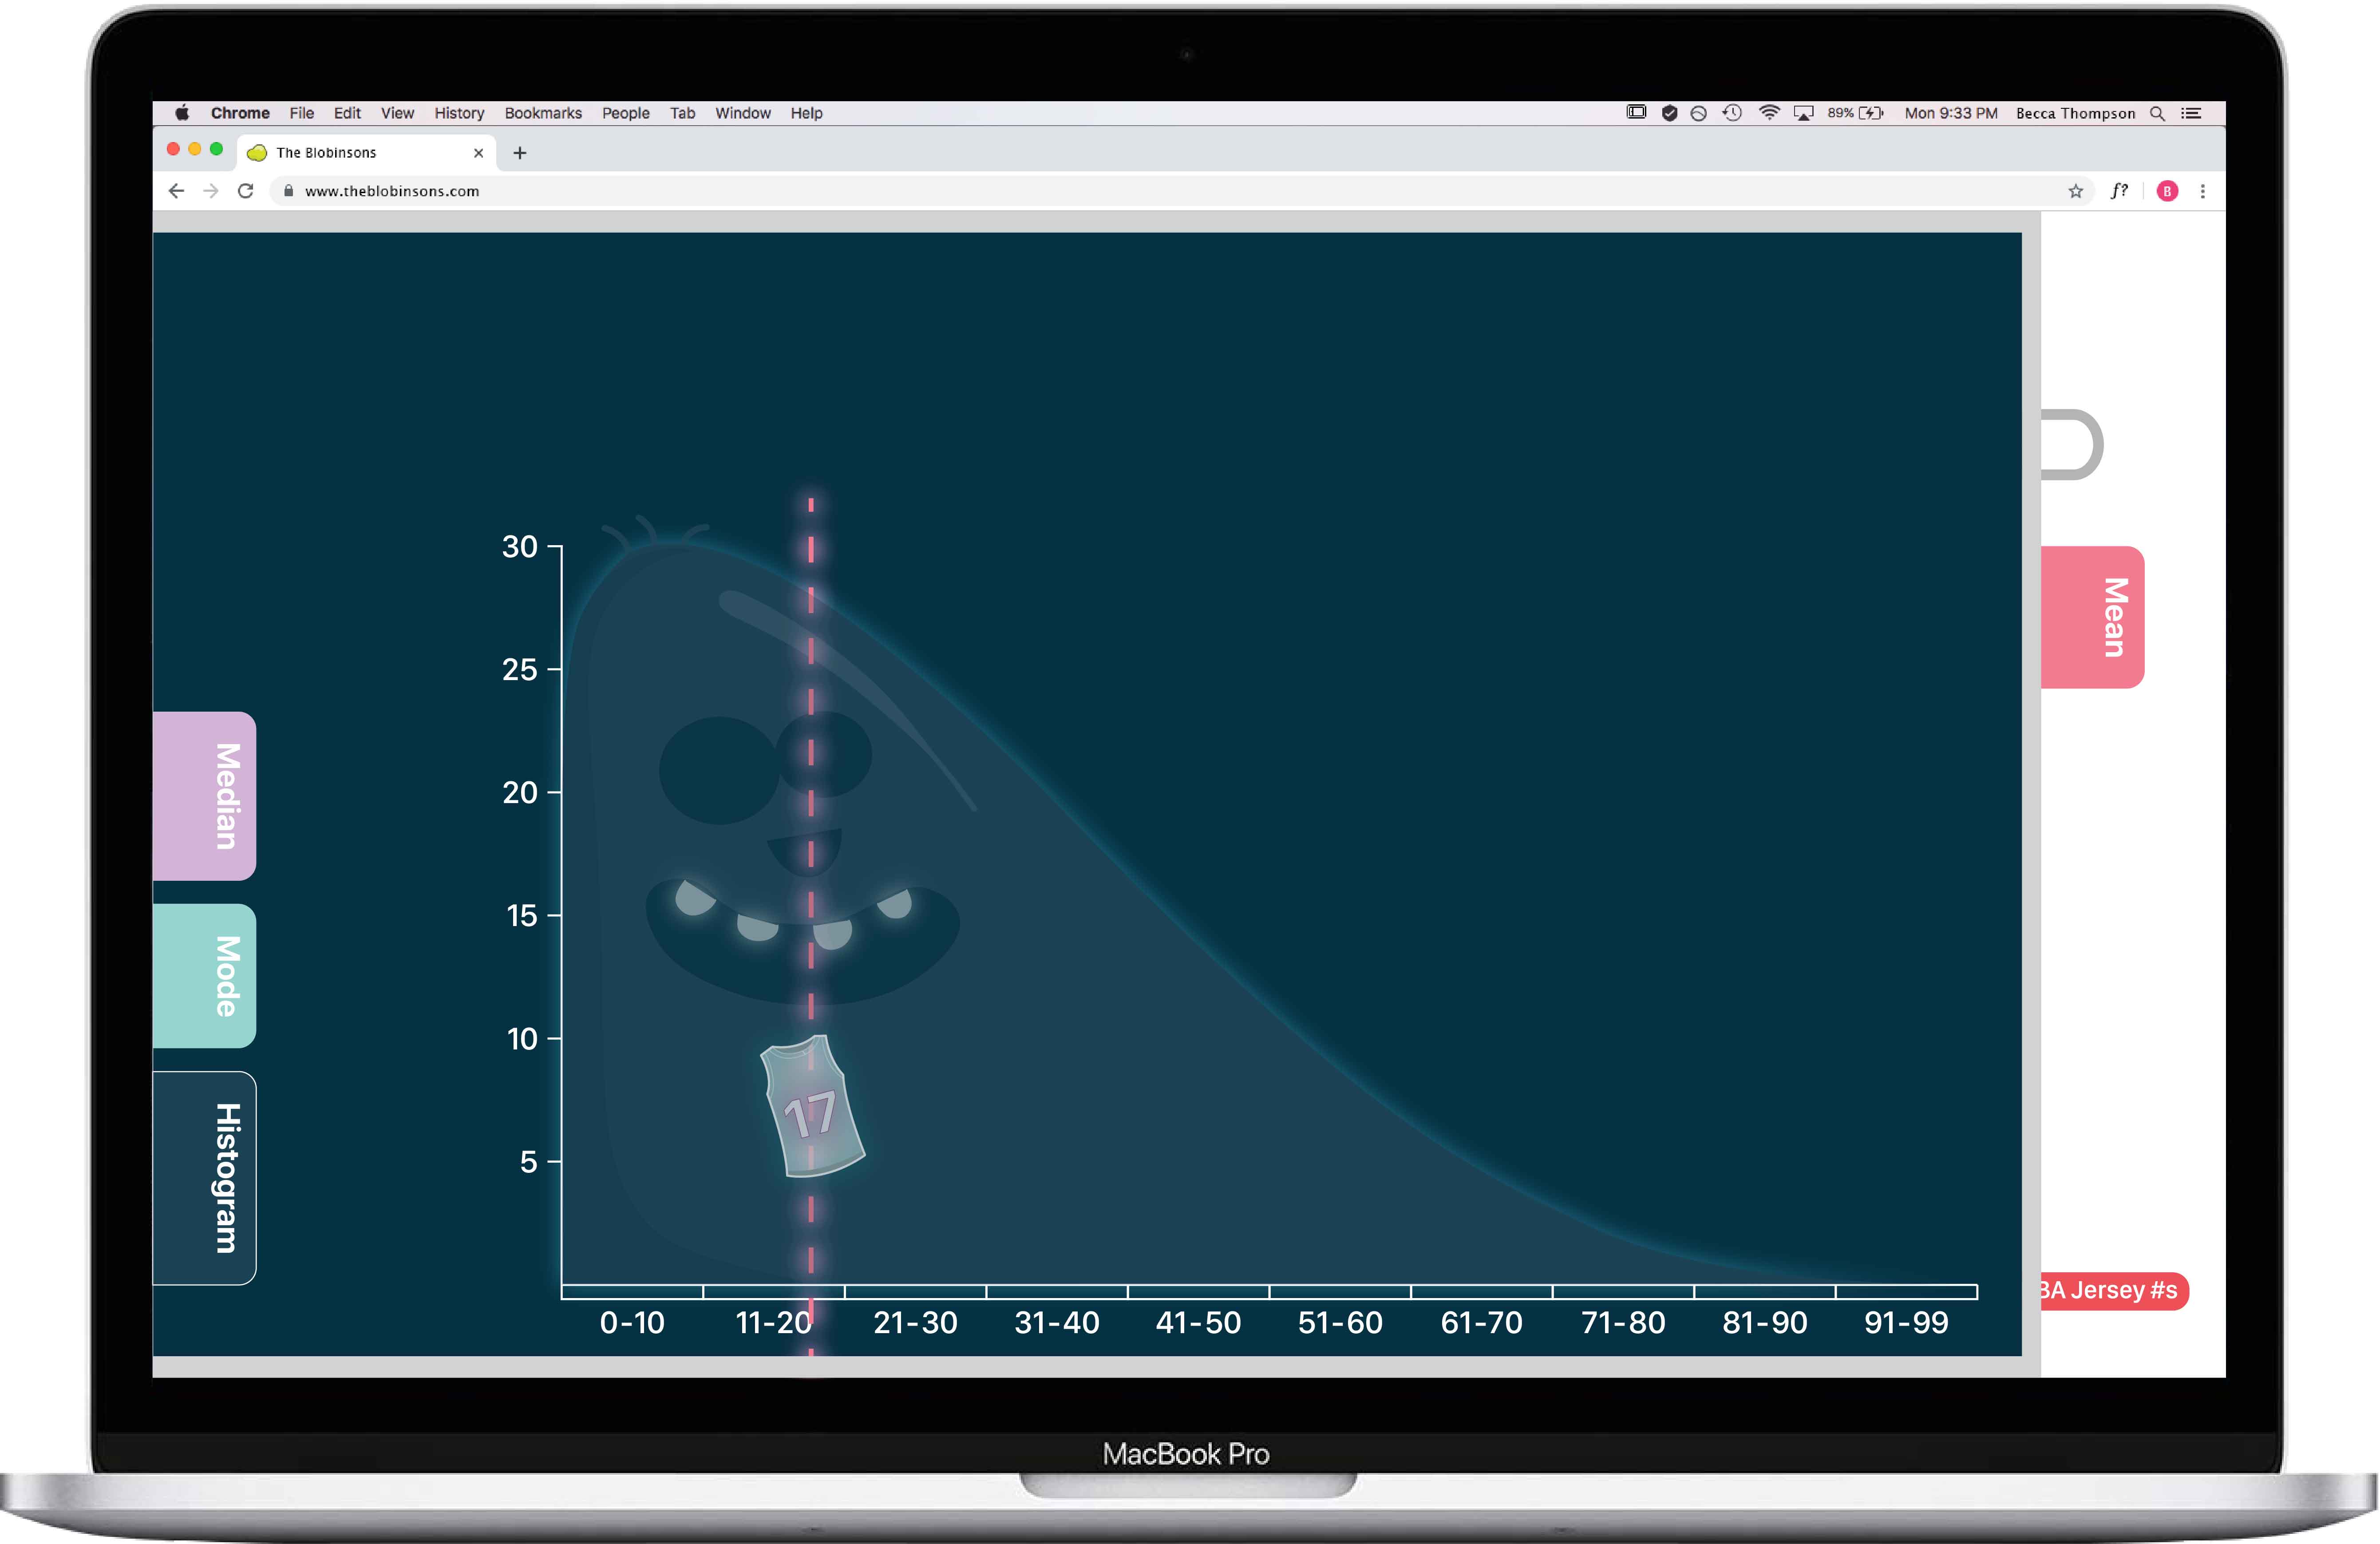
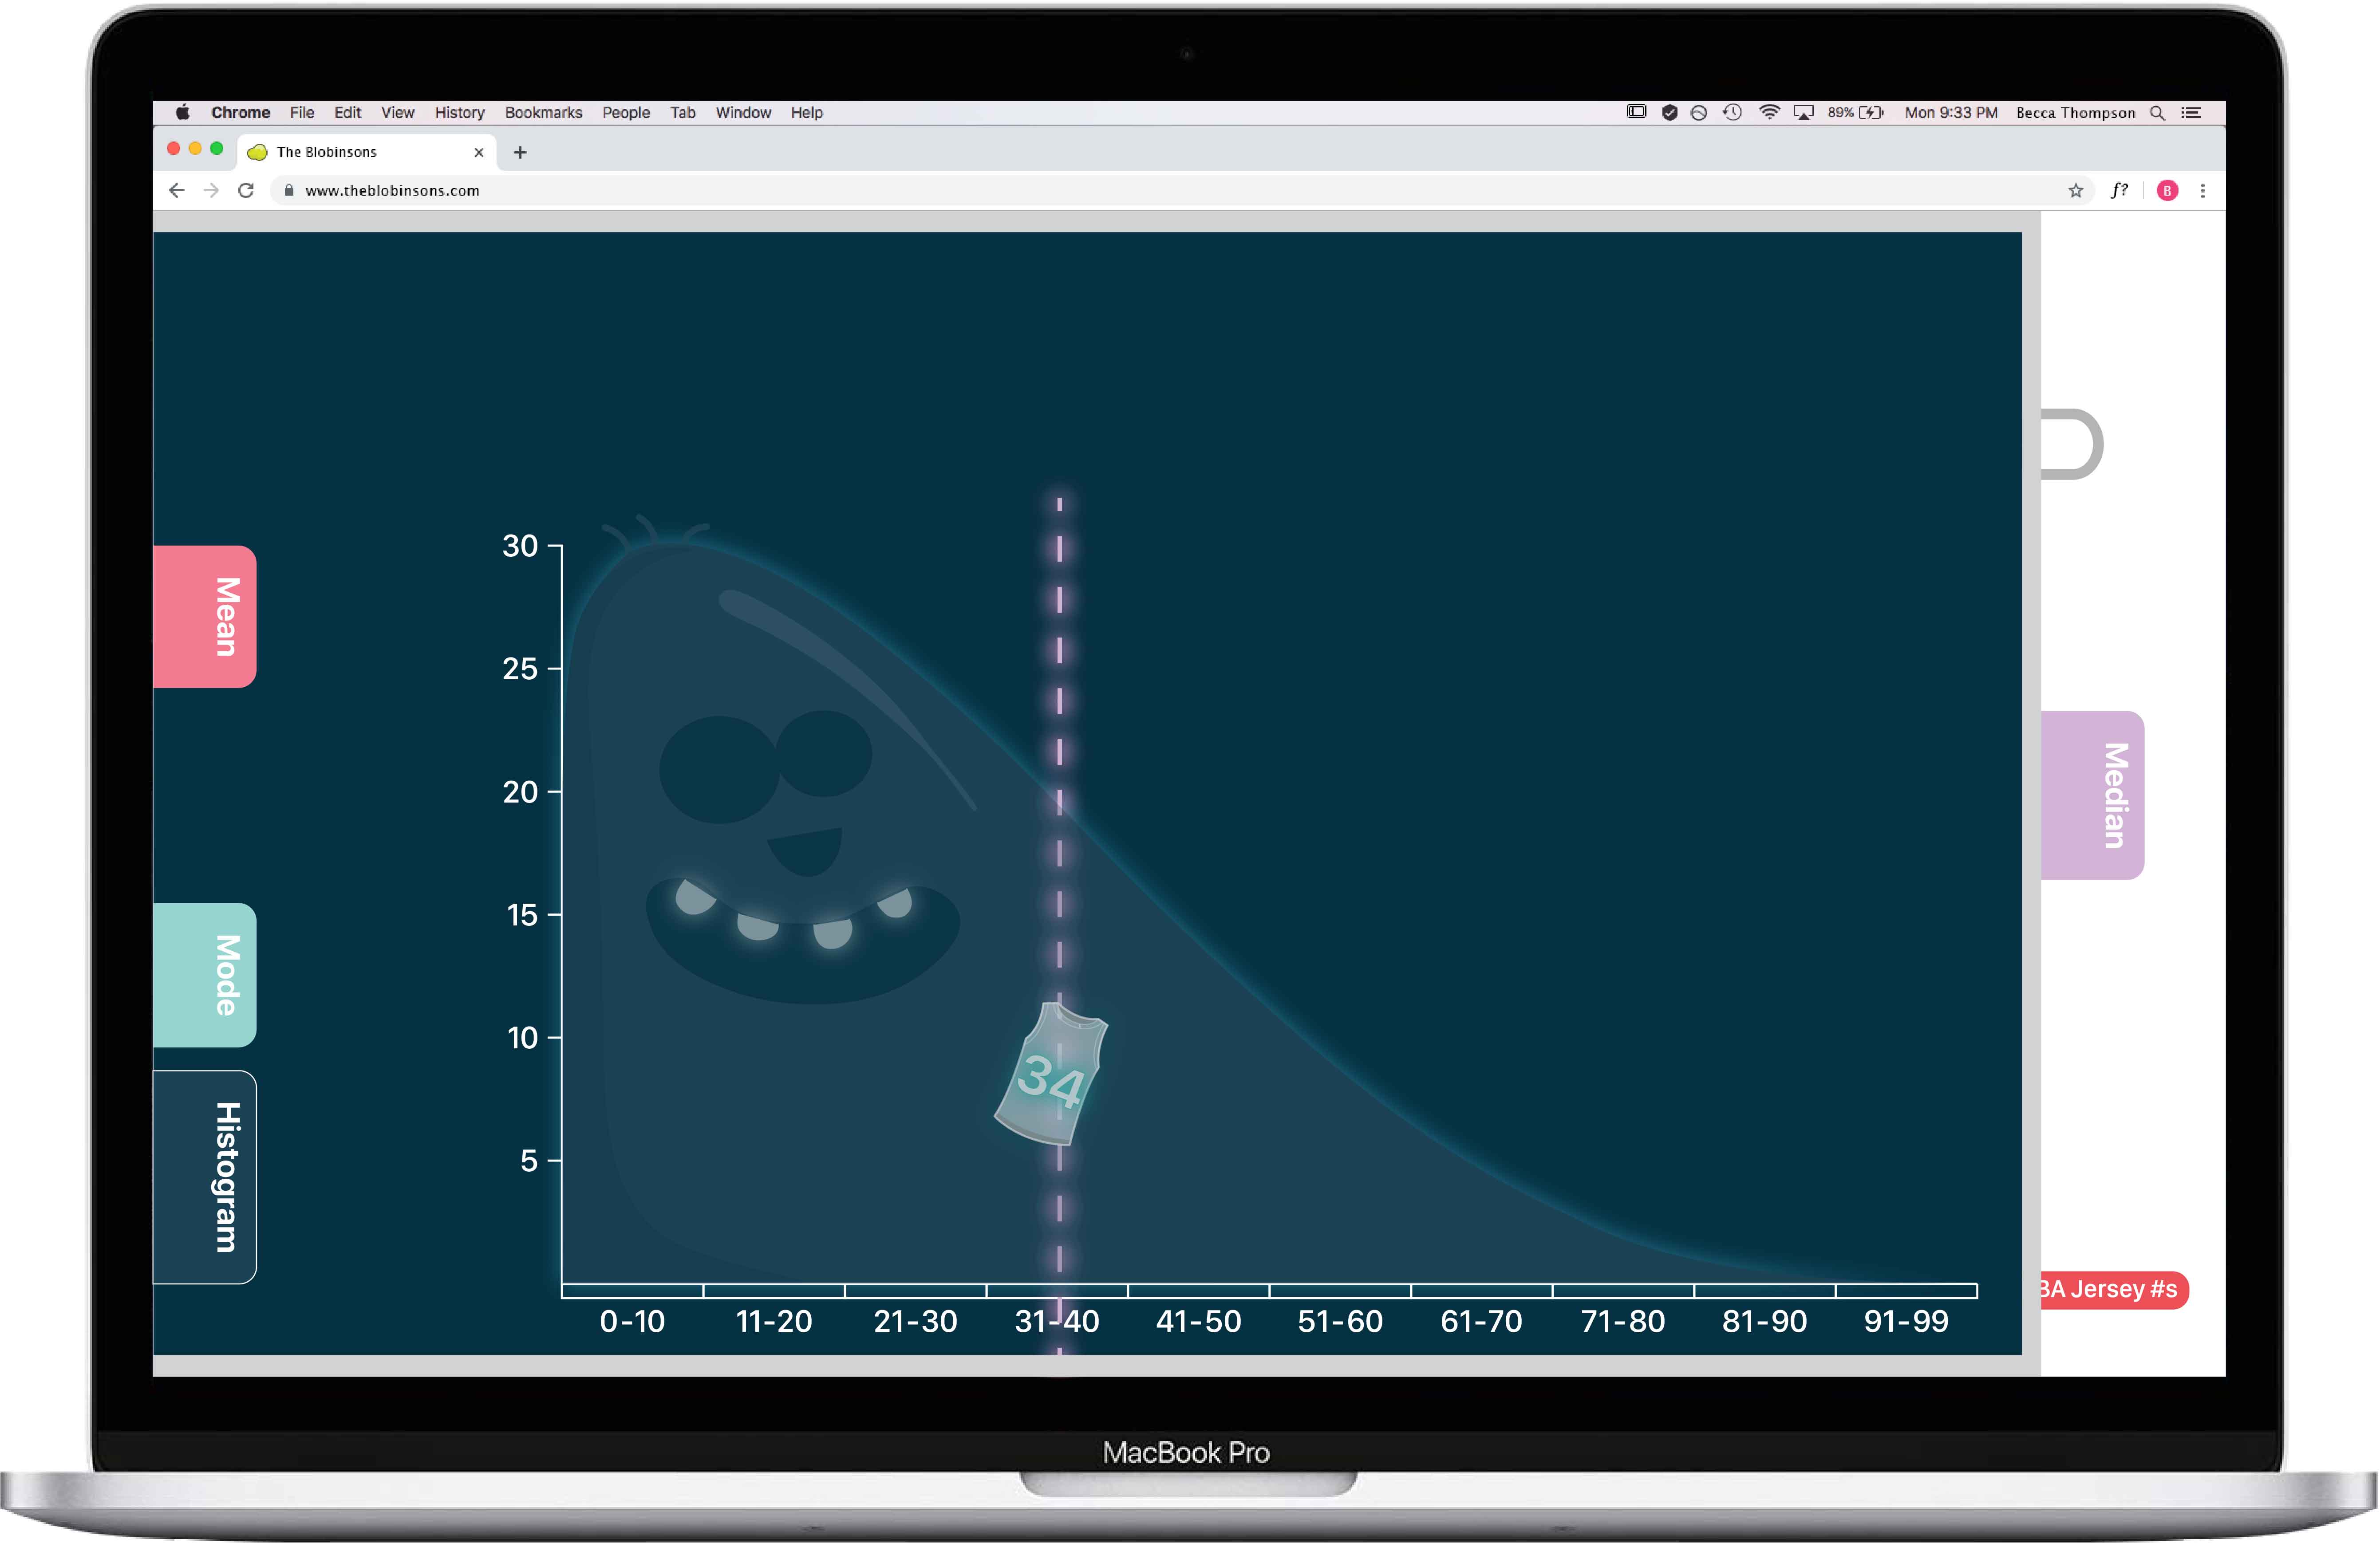
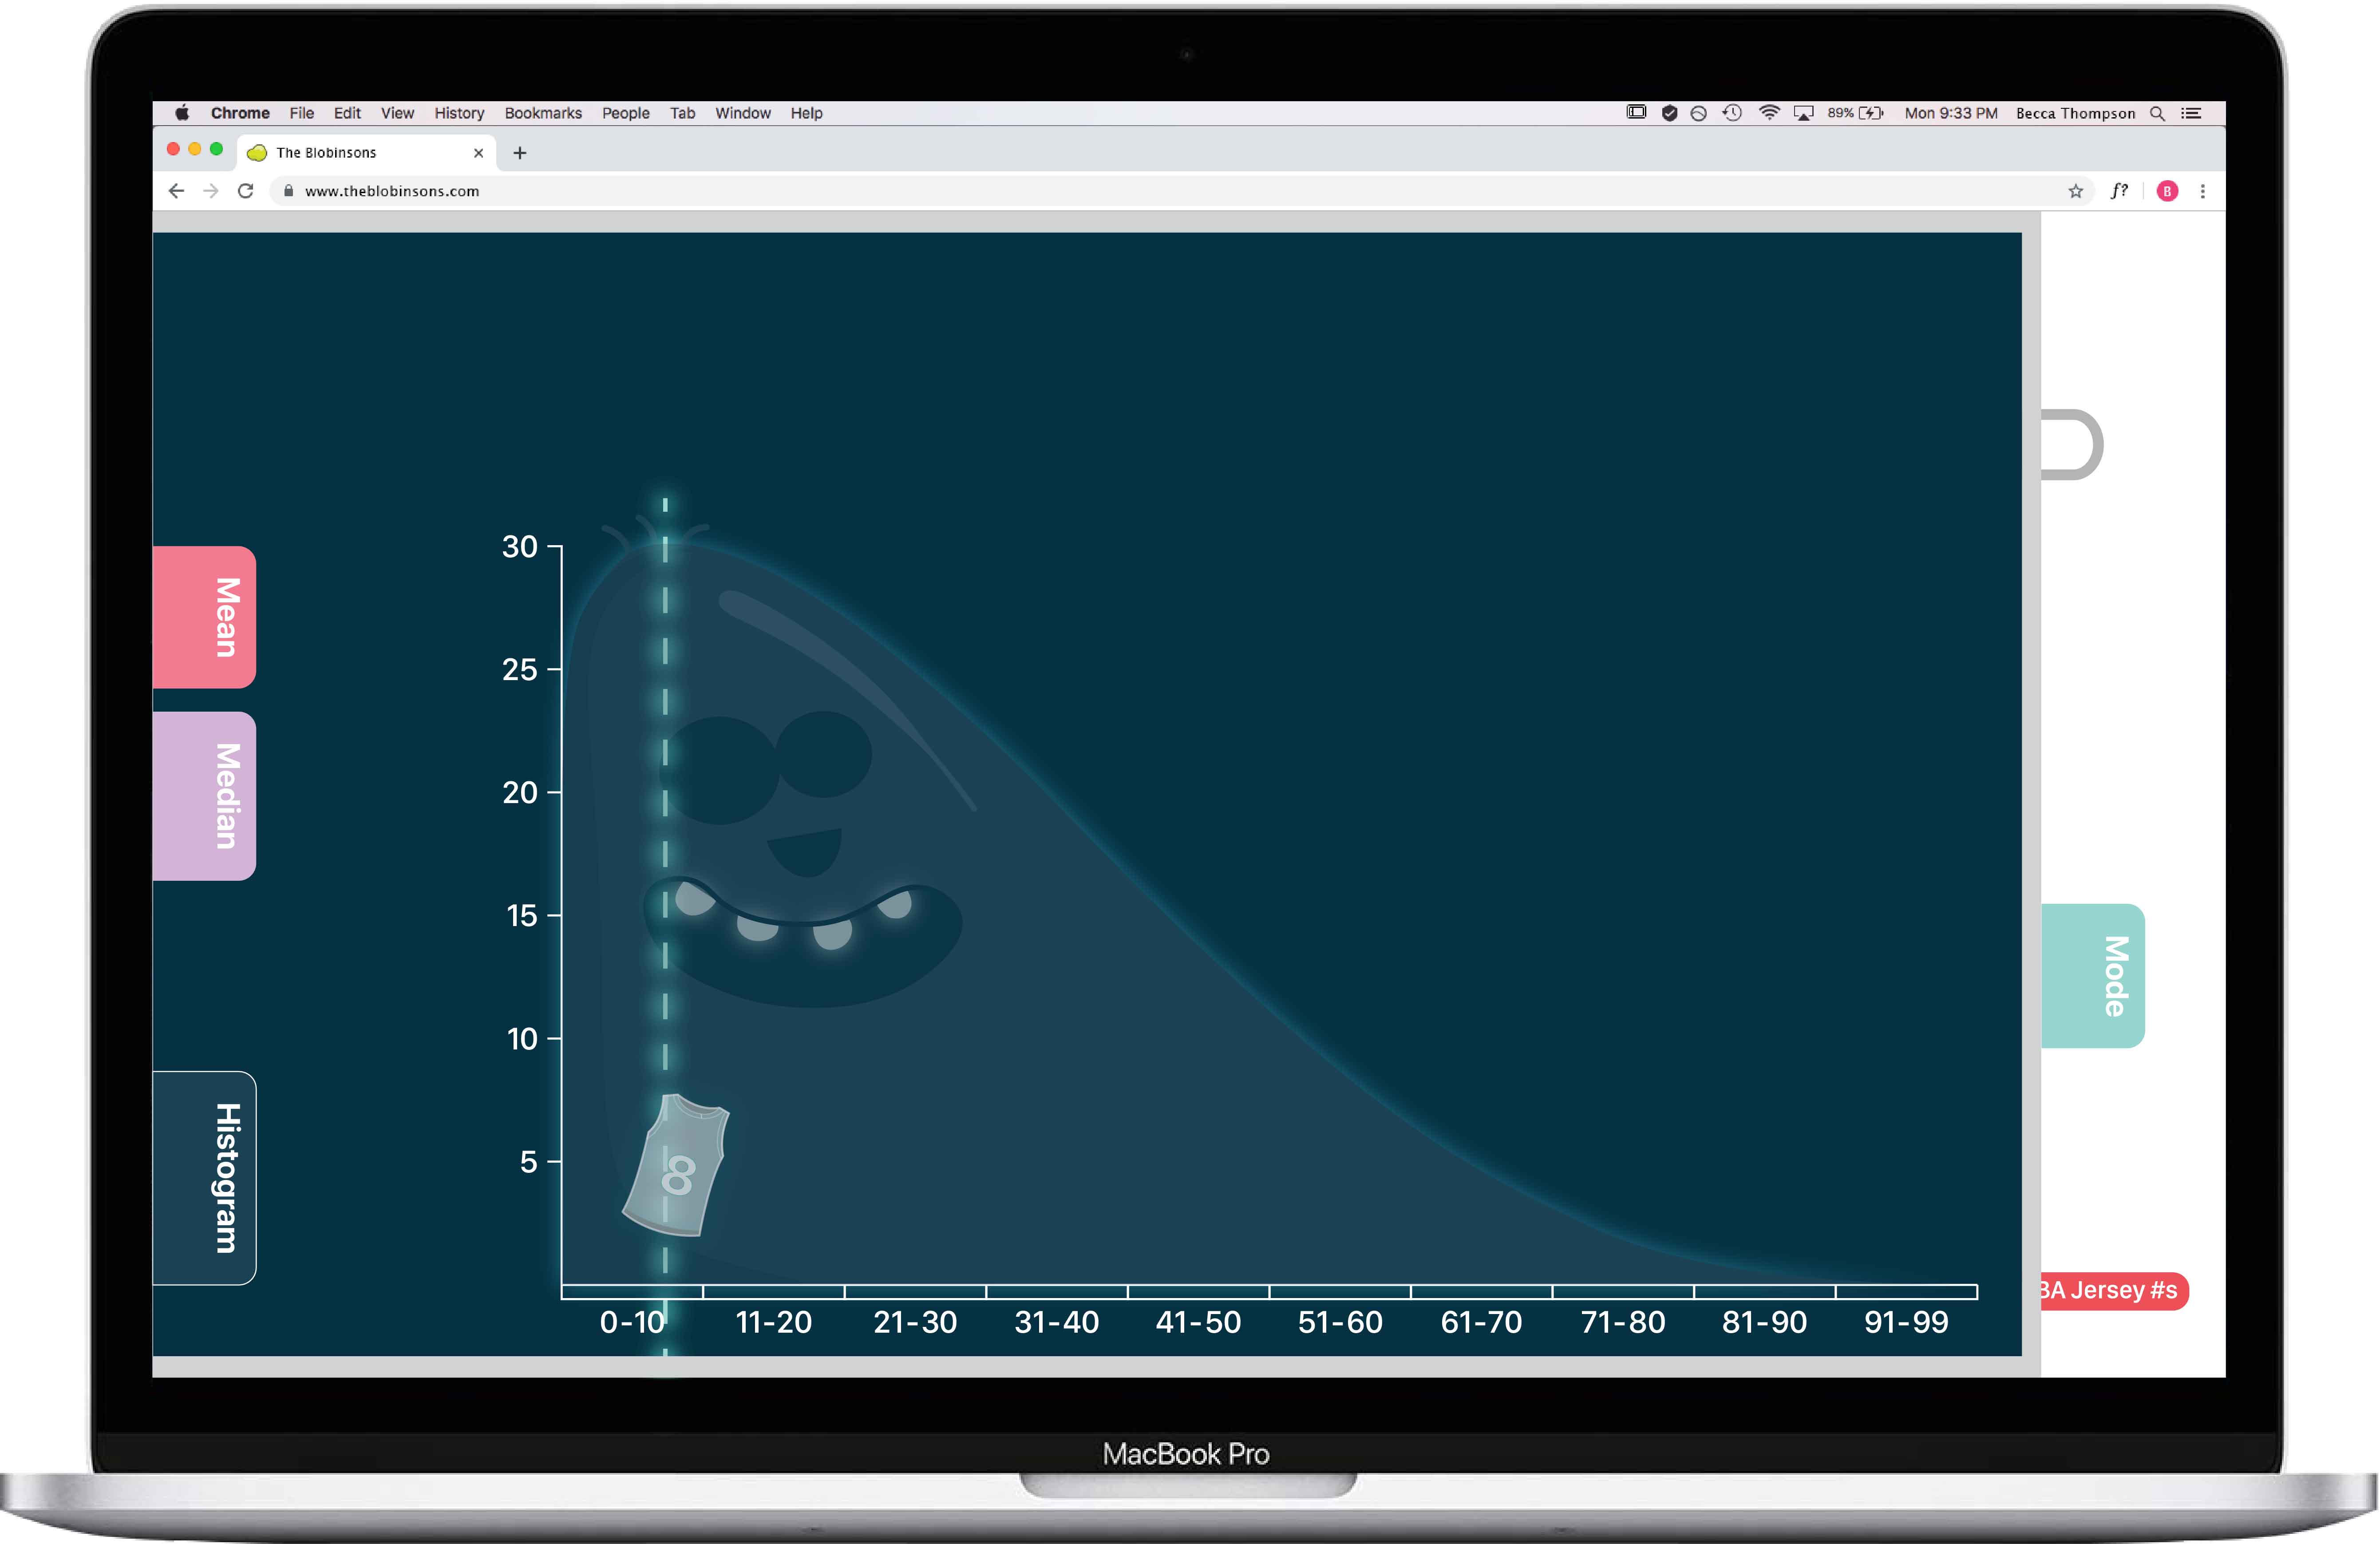
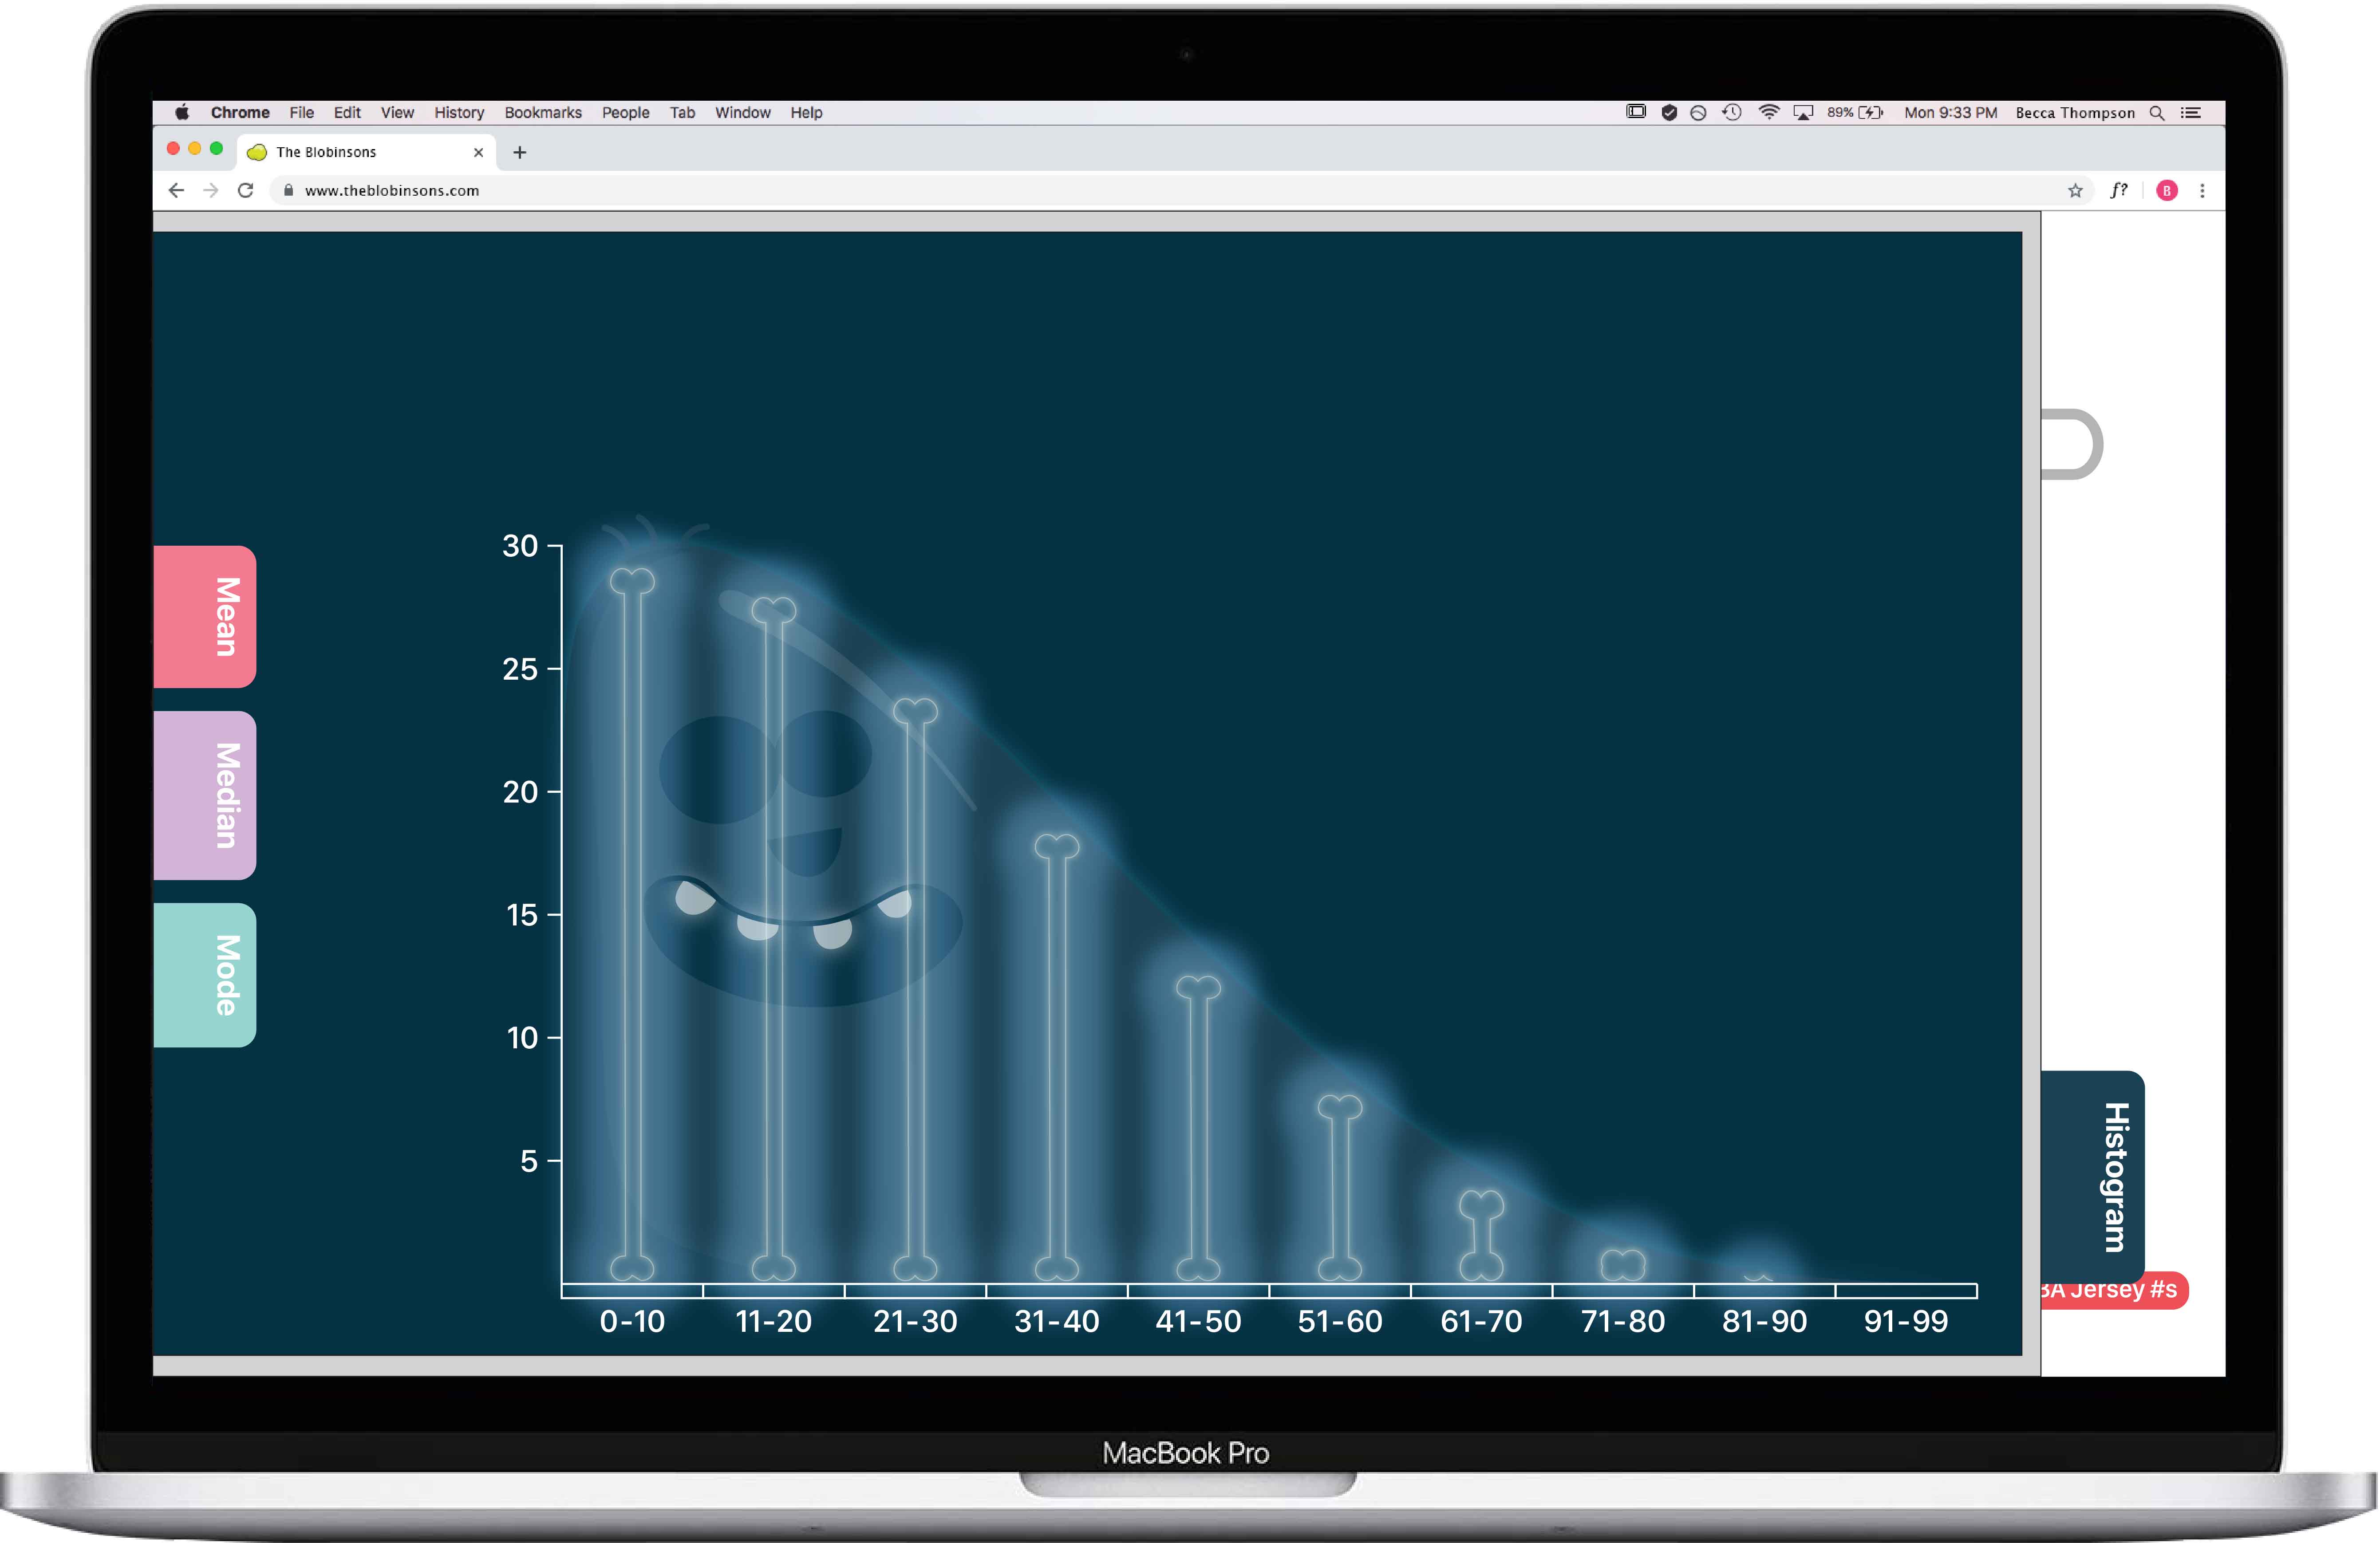
As a student interacts with the blob, the blob will ask them questions based on the information in its data set.
When a student responds to the data question they’ve been asked, the blob will react accordingly.
There are mean, median, mode, and histogram tabs located on the left side of the tool, to give students more information about the blob they are interacting with. For example, if a student drags the histogram tab over the blob, they will see that blob’s histogram.
If a student doesn’t engage with the tool for a period of the time, the blob will be prompted to ask the student if they need help.
To encourage students to return to the tool, each time they log in, they are greeted with a new set of blob characters that represent new data sets. This allows for a wide range of data sets covering different topics so it’s guaranteed a student will find a topic they’re interested in.
Students also have to opportunity to input their own data into our tool—which we envision as a class activity rather than an individual experience.
In this scenario, our persona, Becca, has been sick and absent from school. Lying in bed, she pulls out an assignment on distribution but is confused. She remembers her teacher mentioning a tool that could help, so she grabs her laptop and logs in.
At the conclusion of our project, we went back to where it had all began, SAS headquarters, and presented our final tool to some of their top executives.